. 2021 Mar 5;11(3):386.
doi: 10.3390/biom11030386.

Structural Analysis of the cl-Par-4 Tumor Suppressor as a Function of Ionic Environment

Affiliations

Structural Analysis of the cl-Par-4 Tumor Suppressor as a Function of Ionic Environment

Krishna K Raut et al. Biomolecules. .

Abstract

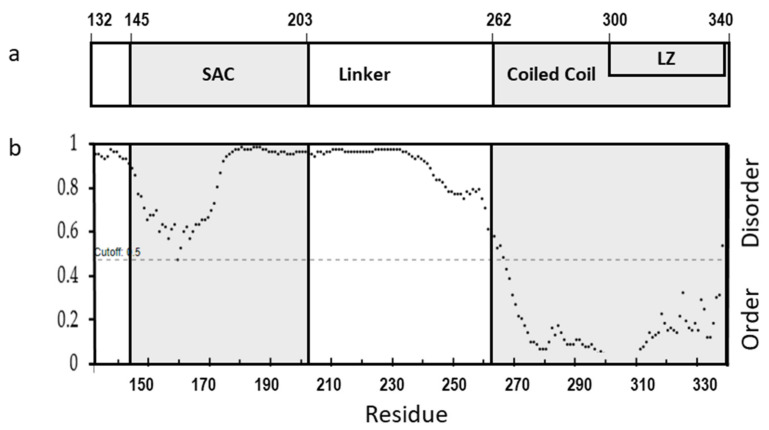
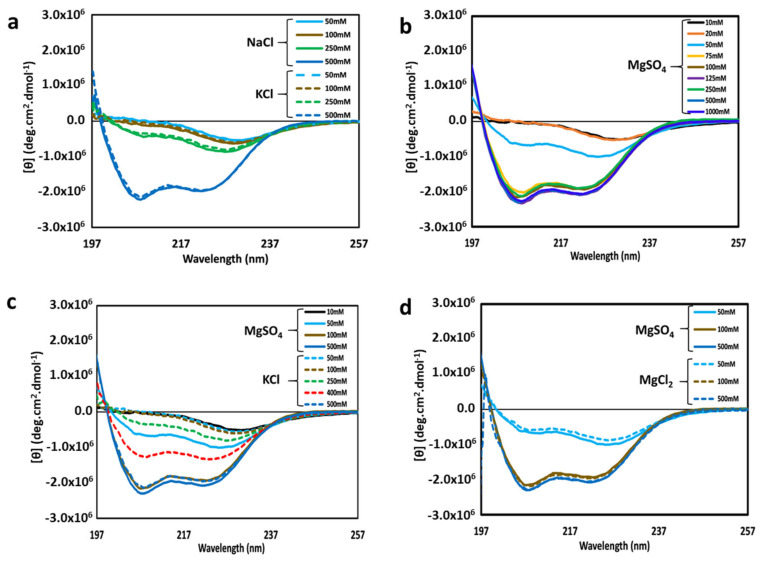
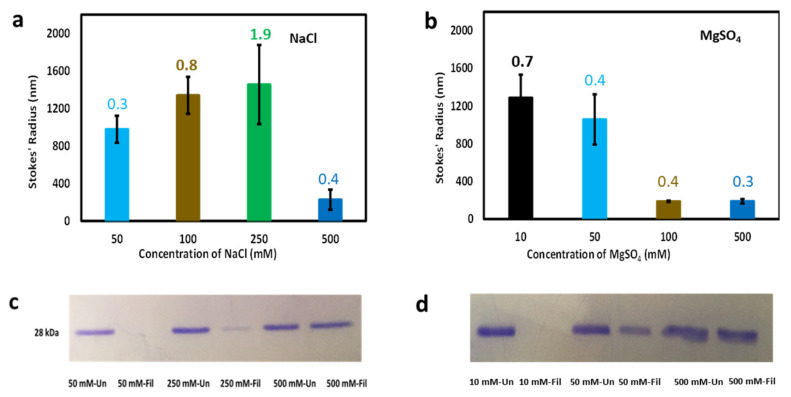
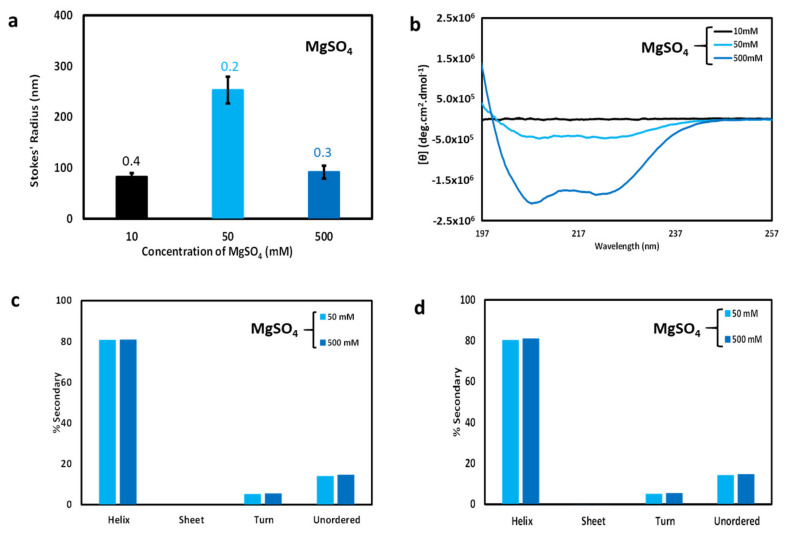
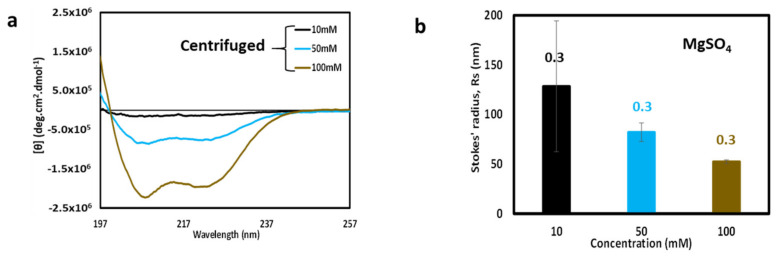
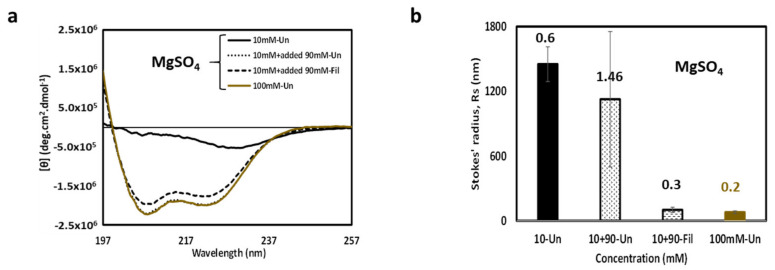
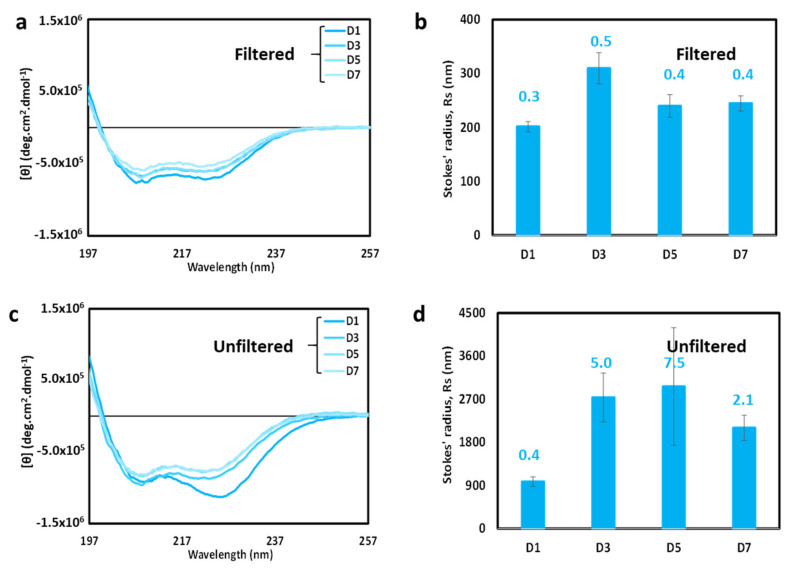
Prostate apoptosis response-4 (Par-4) is a proapoptotic tumor suppressor protein that has been linked to a large number of cancers. This 38 kilodalton (kDa) protein has been shown to be predominantly intrinsically disordered in vitro. In vivo, Par-4 is cleaved by caspase-3 at Asp-131 to generate the 25 kDa functionally active cleaved Par-4 protein (cl-Par-4) that inhibits NF-κB-mediated cell survival pathways and causes selective apoptosis in tumor cells. Here, we have employed circular dichroism (CD) spectroscopy and dynamic light scattering (DLS) to assess the effects of various monovalent and divalent salts upon the conformation of cl-Par-4 in vitro. We have previously shown that high levels of sodium can induce the cl-Par-4 fragment to form highly compact, highly helical tetramers in vitro. Spectral characteristics suggest that most or at least much of the helical content in these tetramers are non-coiled coils. Here, we have shown that potassium produces a similar effect as was previously reported for sodium and that magnesium salts also produce a similar conformation effect, but at an approximately five times lower ionic concentration. We have also shown that anion identity has far less influence than does cation identity. The degree of helicity induced by each of these salts suggests that the "Selective for Apoptosis in Cancer cells" (SAC) domain-the region of Par-4 that is most indispensable for its apoptotic function-is likely to be helical in cl-Par-4 under the studied high salt conditions. Furthermore, we have shown that under medium-strength ionic conditions, a combination of high molecular weight aggregates and smaller particles form and that the smaller particles are also highly helical, resembling at least in secondary structure, the tetramers found at high salt.

Keywords: aggregation; caspase; circular dichroism (CD) spectroscopy; coiled-coil; dynamic light scattering (DLS); intrinsically disordered protein (IDP); prostate apoptosis response-4 (Par-4); tumor suppressor.


Conflict of interest statement

The authors declare no conflict of interest.

Figures

Figure 1
Figure 1
(a) Schematic diagram showing domains of cleaved Par-4 protein (cl-Par-4) and (b) Disorder prediction in cl-Par-4 using DISOPRED3.
Figure 2
Figure 2
Overlay of circular dichroism (CD) spectra of cl-Par-4 at various concentrations of the following salts: (a) NaCl (solid lines) and KCl (dashed lines); (b) MgSO4; (c) MgSO4 (solid lines) and KCl (dashed lines); (d) MgSO4 (solid lines) and MgCl2 (dashed lines). The salt concentrations are indicated by the color legend within each panel. All spectra were recorded at pH 7.0.
Figure 3
Figure 3
Particle size analysis of cl-Par-4 as a function of salt concentration. (a) dynamic light scattering (DLS)-derived Stokes’ radii vs. NaCl concentration. (b) DLS-derived Stokes’ radii vs. MgSO4 concentration. (c) SDS-PAGE analysis of samples from panel (a), before and after filtration. (d) SDS-PAGE analysis of samples from panel (b), before and after filtration. In panels (a) and (b), error bars represent the standard deviation in Stokes’ radii from multiple runs, and the number above each bar represents the average polydispersity value for these runs.
Figure 4
Figure 4
Effect of filtration on cl-Par-4 samples as a function of MgSO4 concentration. (a) DLS-derived Stokes’ radii after filtering. Error bars represent the standard deviation in Stokes’ radii from multiple runs, and the number above each bar represents the average polydispersity value for these runs. (b) CD spectra after filtration. (c) Secondary structure analysis via deconvolution of CD spectra from Figure 2b [unfiltered samples]. (d) Secondary structure analysis via deconvolution of CD spectra from Figure 4b [filtered samples]. Secondary structure analysis of unfiltered and filtered 10 mM MgSO4 samples was not possible due to the presence of large particles and low protein concentration, respectively.
Figure 5
Figure 5
CD spectra and DLS analysis after centrifugation. (a) Overlay of CD spectra of supernatant after centrifugation of cl-Par-4 at various concentrations of MgSO4. The salt concentrations are indicated by the color legend within the panel. (b) Corresponding DLS of samples from panel (a). Error bars represent the standard deviation in Stokes’ radii from multiple runs, and the number above each bar represents the average polydispersity value for these runs.
Figure 6
Figure 6
CD spectra and DLS analysis after reintroduction of salt. (a) 10 mM MgSO4 sample (solid black line) shows signs of large species formation (loss of signal); This signal loss can be eliminated by increasing the MgSO4 concentration to 100 mM (dotted black line); the resulting spectrum overlaps nearly perfectly with that of the original 100 mM sample (solid brown line). The dashed black line represents the slightly reduced CD spectrum of the added MgSO4 sample after filtration to remove any remaining large particles. (b) Corresponding DLS of samples from panel (a). Error bars represent the standard deviation in Stokes’ radii from multiple runs, and the number above each bar represents the average polydispersity value for these runs.
Figure 7
Figure 7
Time-dependence of cl-Par-4 in the presence of 50 mM MgSO4. (a) Overlay of CD spectra obtained over a seven-day time course. Sample was filtered on day 1 prior to the first spectrum. (b) DLS analysis of sample from panel (a). (c) Overlay of CD spectra obtained over a seven-day time course. Sample was NOT filtered. (d) DLS analysis of sample from panel (c). In panels (b) and (d), error bars represent the standard deviation in Stokes’ radii from multiple runs, and the number above each bar represents the average polydispersity value for these runs.

References

    1. El-Guendy N., Zhao Y., Gurumurthy S., Burikhanov R., Rangnekar V.M. Identification of a Unique Core Domain of Par-4 Sufficient for Selective Apoptosis Induction in Cancer Cells. Mol. Cell Biol. 2003;23:5516–5525. doi: 10.1128/MCB.23.16.5516-5525.2003. - DOI - PMC - PubMed
    1. Rangnekar V.M. Advances in Cell Aging and Gerontology. Elsevier; Amsterdam, The Netherlands: 2001. Apoptosis by par-4 protein; pp. 215–236.
    1. Boghaert E.R., Sells S.F., Walid A.J., Malone P., Williams N.M., Weinstein M.H., Strange R., Rangnekar V.M. Immunohistochemical analysis of the proapoptotic protein Par-4 in normal rat tissues. Cell Growth Differ. 1997;8:881–890. - PubMed
    1. Gurumurthy S., Goswami A., Vasudevan K.M., Rangnekar V.M. Phosphorylation of Par-4 by protein kinase A is critical for apoptosis. Mol. Cell Biol. 2005;25:1146–1161. - PMC - PubMed
    1. Rasool R.U., Nayak D., Chakraborty S., Katoch A., Faheem M.M., Amin H., Goswami A. A journey beyond apoptosis: New enigma of controlling metastasis by pro-apoptotic Par-4. Clin. Exp. Metastasis. 2016;33:757–764. doi: 10.1007/s10585-016-9819-5. - DOI - PubMed

Publication types

MeSH terms

Substances

LinkOut - more resources