. 2021 Mar 30;22(7):3557.
doi: 10.3390/ijms22073557.

Pseudo-Starvation Driven Energy Expenditure Negatively Affects Ovarian Follicle Development

Affiliations

Pseudo-Starvation Driven Energy Expenditure Negatively Affects Ovarian Follicle Development

Li Meng et al. Int J Mol Sci. .

Abstract

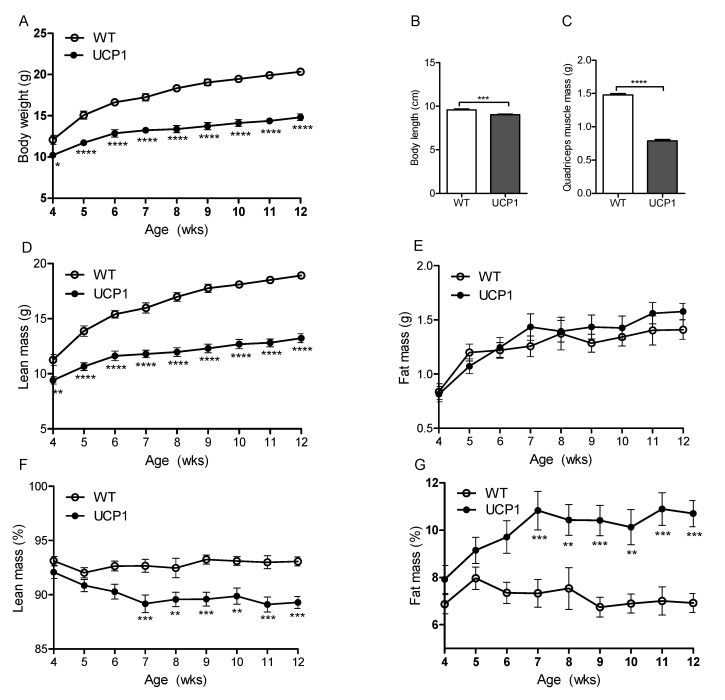
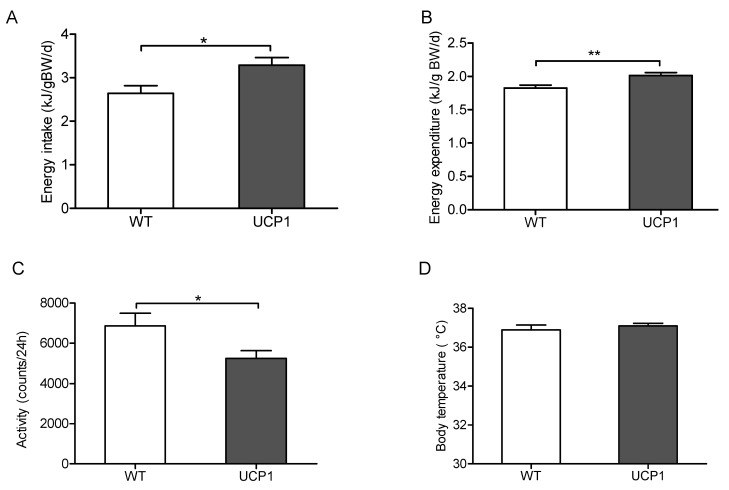
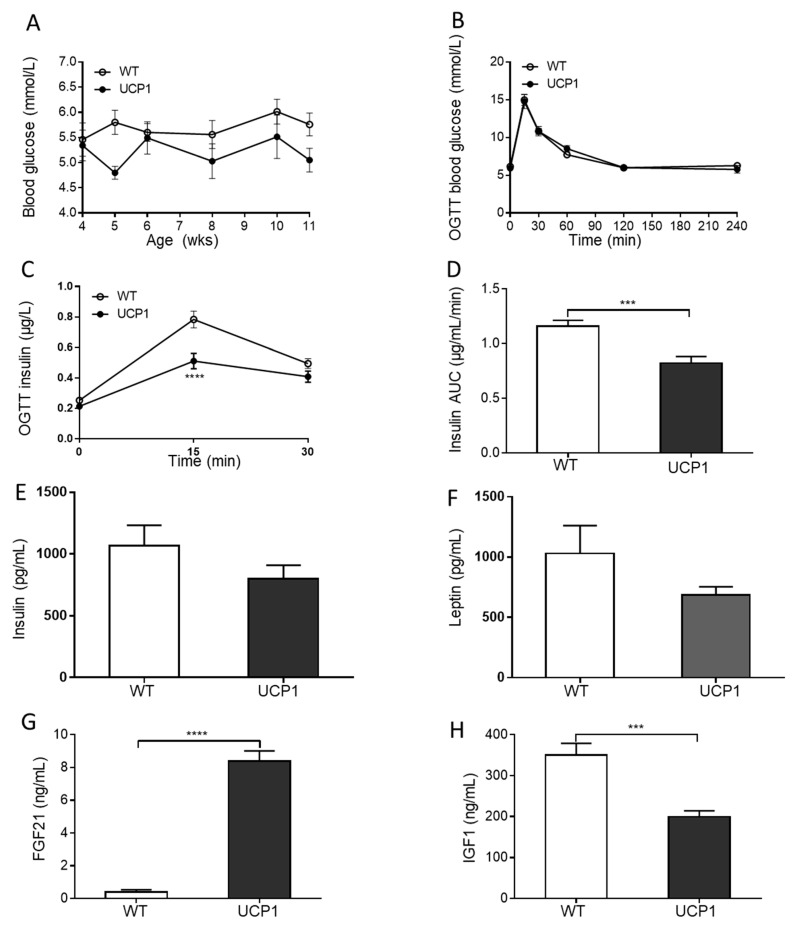
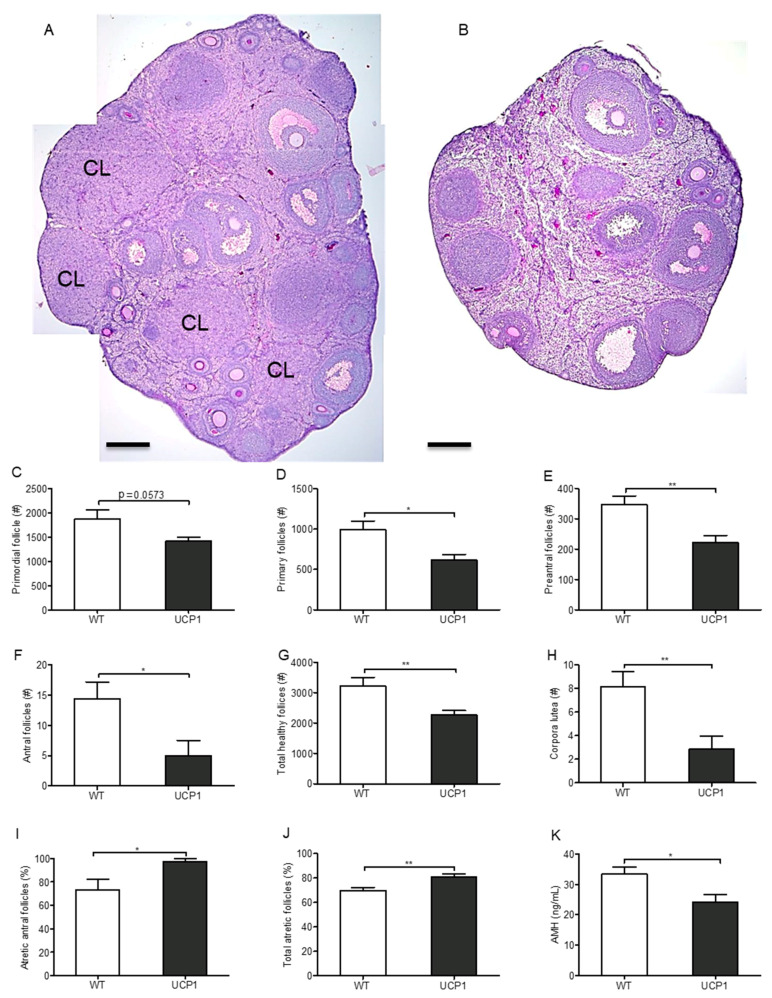
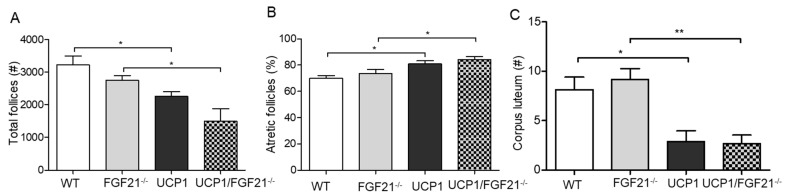
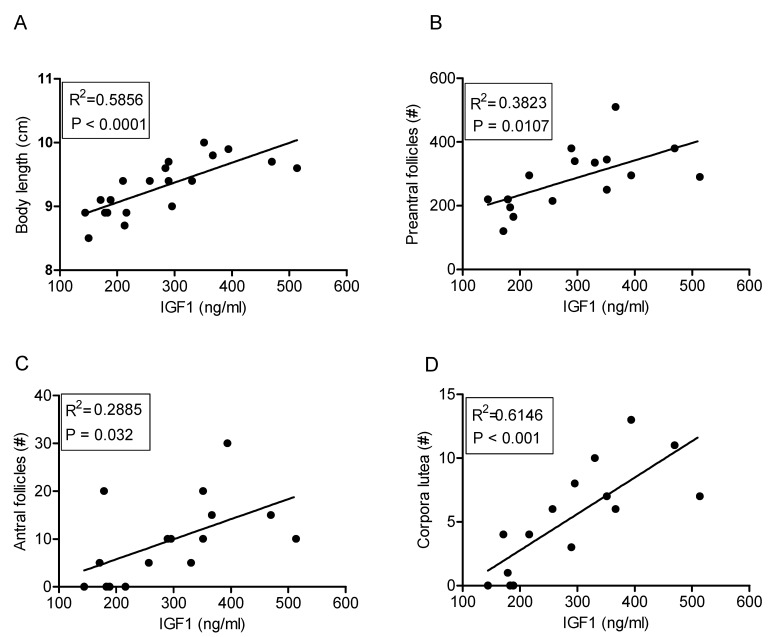
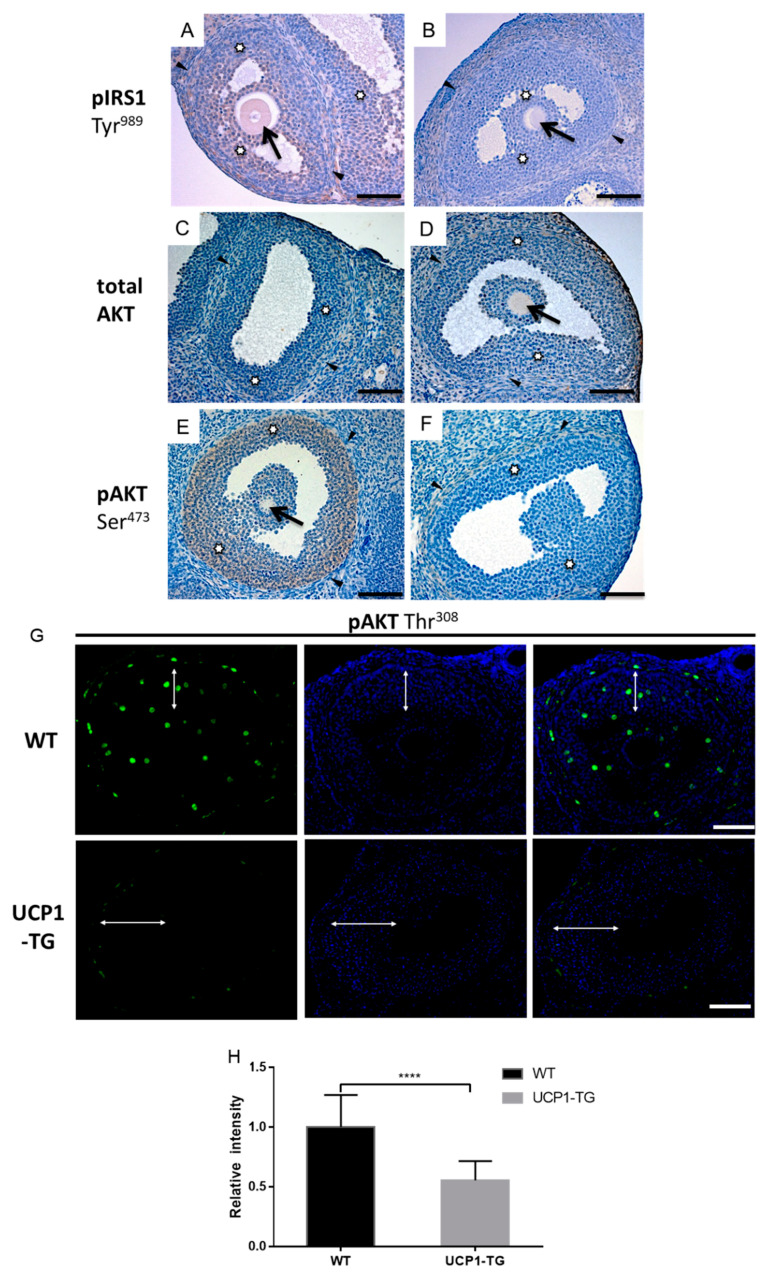
In the present investigation, we examined whether a change in whole body energy fluxes could affect ovarian follicular development, employing mice ectopically expressing uncoupling protein 1 in skeletal muscle (UCP1-TG). Female UCP1-TG and wild-type (WT) mice were dissected at the age of 12 weeks. Energy intake and expenditure, activity, body weight and length, and body composition were measured. Plasma insulin, glucose, leptin, plasma fibroblast growth factor 21 (FGF21) and plasma insulin-like growth factor 1 (IGF1) levels were analyzed and ovarian follicle and corpus luteum numbers were counted. IGF1 signaling was analyzed by immunohistochemical staining for the activation of insulin receptor substrate 1/2 (IRS1/2) and AKT. UCP1-TG female mice had increased energy expenditure, reduced body size, maintained adiposity, and decreased IGF1 concentrations compared to their WT littermates, while preantral and antral follicle numbers were reduced by 40% and 60%, respectively. Corpora lutea were absent in 40% of the ovaries of UCP1-TG mice. Phospho-IRS1, phospho-AKT -Ser473 and -Thr308 immunostaining was present in the granulosa cells of antral follicles in WT ovaries, but faint to absent in the antral follicles of UCP1-TG mice. In conclusion, the reduction in circulating IGF1 levels due to the ectopic expression of UCP1 is associated with reduced immunostaining of the IRS1-PI3/AKT pathway, which may negatively affect ovarian follicle development and ovulation.

Keywords: AKT; IGF1; IRS1; UCP1; energy metabolism; ovarian follicular development.


Conflict of interest statement

The authors declare no conflict of interest.

Figures

Figure 1
Figure 1
Morphometric data of female mice overexpressing UCP1 in skeletal muscle (UCP1-TG; UCP1) and wild-type (WT) littermate controls, both fed chow diets for 12 weeks. Body weight development (A), body length at week 12 of age (B), quadriceps weight at the age of 12 weeks (C), lean body mass development (D), body fat mass development (E), lean body mass as percentage of body mass (F) body fat mass as percentage of body mass (G) were determined. Statistical analyses were carried out based on 8 mice per group, except for body length and quadriceps weight (n = 10). Data are expressed as mean +/− SEM; (A,D,E,F,G): two-way ANOVA; (B,C): Student’s t-test; * p < 0.05, ** p < 0.01, *** p < 0.001, **** p < 0.0001.
Figure 2
Figure 2
Energy intake (A), energy expenditure (B), activity counts over 24 h (C) and body temperature (D) in 12-week-old UCP1-TG (UCP1) and wild-type (WT) littermate controls fed a chow diet. Data are expressed as mean +/− SEM (n = 8); (AD): Student’s t-test; * p < 0.05, ** p < 0.01.
Figure 3
Figure 3
Metabolic health related parameters of UCP1-TG (UCP1) and WT mice. Blood glucose levels from the age of 4 until 11 weeks (A), glucose response to an oral glucose tolerance test (OGTT) at the age of 10 weeks (B), insulin response to the OGTT at the age of 10 weeks (C), incremental area under the curve (AUC) of the insulin response to the OGTT (D), plasma insulin concentrations (pg/mL) (E), plasma leptin concentrations (pg/mL) (F), plasma fibroblast growth factor 21 (FGF21) concentrations (ng/mL) (G) and plasma insulin-like growth factor 1 (IGF1) concentrations (ng/mL) (H). Data are expressed as mean +/− SEM (n = 10); (AC): two-way ANOVA; (DH): Student’s t-test, *** p < 0.001, **** p < 0.0001.
Figure 4
Figure 4
Ovarian follicular development of UCP1-TG (UCP1) and WT mice. Representative images of the gross ovarian morphology of WT (A) and UCP1-TG (B) mice. Numbers of primordial follicles (C), primary follicles (D), preantral follicles (E), antral follicles (F), total number of healthy follicles (G), and corpora lutea (H) per ovary. Percentage of atretic cleaved caspase 3 (cCASP3) positive antral follicles of WT and UCP1-TG mice (I) and percentage of total atretic follicles (of (pre)antral and unknown origin) (J). Plasma anti-Müllerian hormone (AMH) levels (ng/mL) (K). #, numbers; %, percentage; Values represent means +/− SEM 686 (n = 8, except for cCASP3, n = 4); (CK): Student’s t-test * p < 0.05; **, p < 0.01. CL, corpus luteum, scale bar represents 200 μm.
Figure 5
Figure 5
FGF21 and ovarian follicular development. Numbers of healthy follicles (A), percentage of atretic follicles (B), and numbers of corpora lutea (C) in WT (white), FGF21 knock out (FGF21–/–; grey), UCP1-TG (UCP1; black) and FGF21–/–/UCP1-TG (FGF21–/–/UCP1) mice (mixed). Data are expressed as mean +/− SEM (n = 6–8); #, numbers; %, percentage; (AC): one-way ANOVA; *, p < 0.05; **, p < 0.01.
Figure 6
Figure 6
Correlation of plasma IGF1 concentrations with body length and parameters of ovarian follicular development in WT and UCP1-TG (UCP1) mice. Correlations of IGF1 with body length (A), number of preantral follicles (B), number of antral follicles (C) and number of corpora lutea (D); n = 8–10.
Figure 7
Figure 7
Immunostaining for phosphorylated IRS1, total and phosphorylated AKT Ser473 (brown staining) as markers of IGF1 signaling in healthy antral follicles of WT (A,C,E) and UCP1-TG (B,D,F) mice; immunofluorescence staining for phosphorylated AKT Thr308 in WT and UCP1-TG (G,H). Representative immunostaining of IRS1 phosphorylated at Tyr989 (A,B), total AKT (C,D), AKT phosphorylated at Ser473 (E,F) and AKT phosphorylated at Thr308, green, Thr308; blue, DAPI(G). Phosphorylation of IRS1 and AKT Ser473 is present in the granulosa cells of healthy antral follicles in WT ovaries but faint to absent in UCP1-TG mice. Similarly, immunofluorescence analysis showed the significantly decreased intensity of phosphorylated AKT Thr308 in the granulosa cells of healthy antral follicles in UCP1-TG mice in comparison to WT (H). (H): Student’s t-test, ****, p < 0.0001; total AKT immunostaining is moderate in the granulosa cells of WT animals and UCP1-TG mice. There was no difference in theca and stromal cell staining between the WT and UCP1-TG. Inserts show a detail of the granulosa layer. Arrow—oocyte, asterisk (AF) and white two-sided arrow (G)—granulosa cells, arrowheads—theca cells. Scar bar represent 50 μm.

Similar articles

Cited by

References

    1. Wade G.N., Schneider J.E. Metabolic fuels and reproduction in female mammals. Neurosci. Biobehav. Rev. 1992;16:235–272. doi: 10.1016/S0149-7634(05)80183-6. - DOI - PubMed
    1. Speakman J.R., Krol E. The heat dissipation limit theory and evolution of life histories in endotherms—Time to dispose of the disposable soma theory? Integr. Comp. Biol. 2010;50:793–807. doi: 10.1093/icb/icq049. - DOI - PubMed
    1. Bartke A., Sun L.Y., Longo V. Somatotropic signaling: Trade-offs between growth, reproductive development and longevity. Physiol. Rev. 2013;93:571–598. doi: 10.1152/physrev.00006.2012. - DOI - PMC - PubMed
    1. Evans J.J., Anderson G.M. Balancing ovulation and anovulation: Integration of the reproductive and energy balance axes by neuropeptides. Hum. Reprod. Update. 2012;18:313–332. doi: 10.1093/humupd/dms004. - DOI - PubMed
    1. Visscher M.B., King J.T., Lee Y.C. Further studies on influence of age and diet upon reproductive senescence in strain A female mice. Am. J. Physiol. 1952;170:72–76. doi: 10.1152/ajplegacy.1952.170.1.72. - DOI - PubMed

MeSH terms

LinkOut - more resources