

The Pro-Apoptotic Effect of Silica Nanoparticles Depends on Their Size and Dose, as Well as the Type of Glioblastoma Cells
- PMID: 33808150
- PMCID: PMC8037515
- DOI: 10.3390/ijms22073564
The Pro-Apoptotic Effect of Silica Nanoparticles Depends on Their Size and Dose, as Well as the Type of Glioblastoma Cells
Abstract
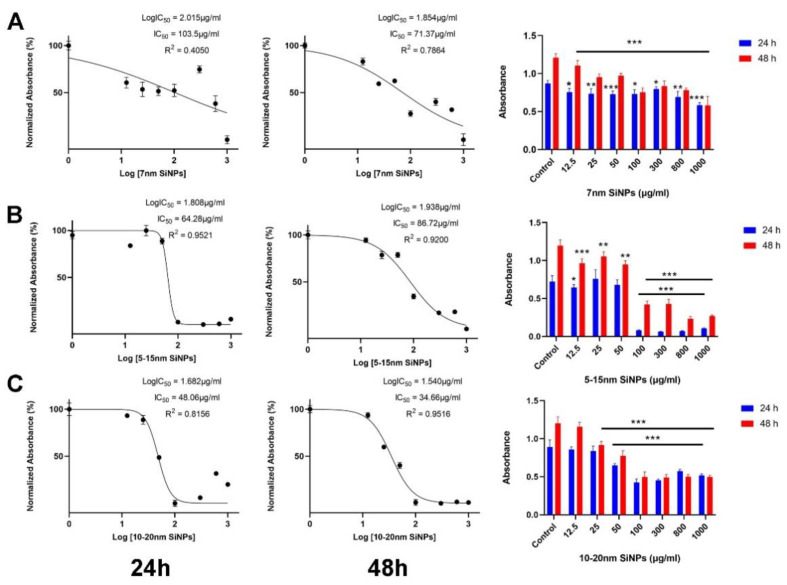
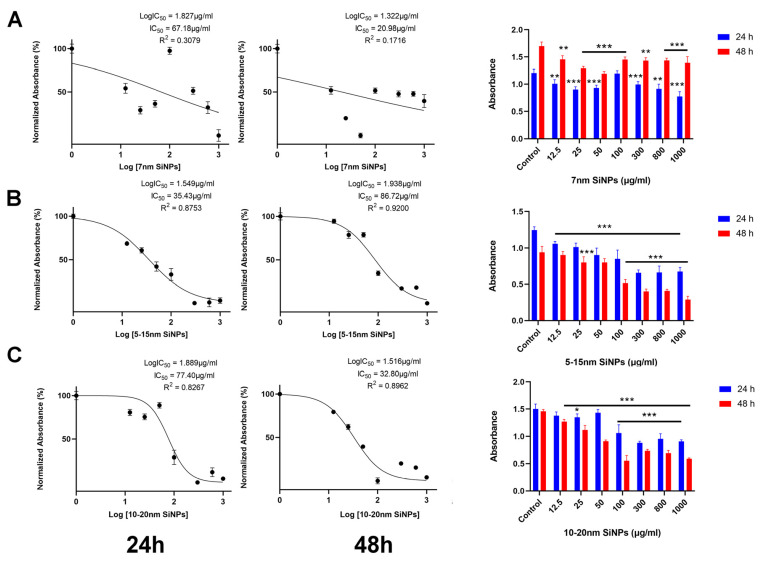
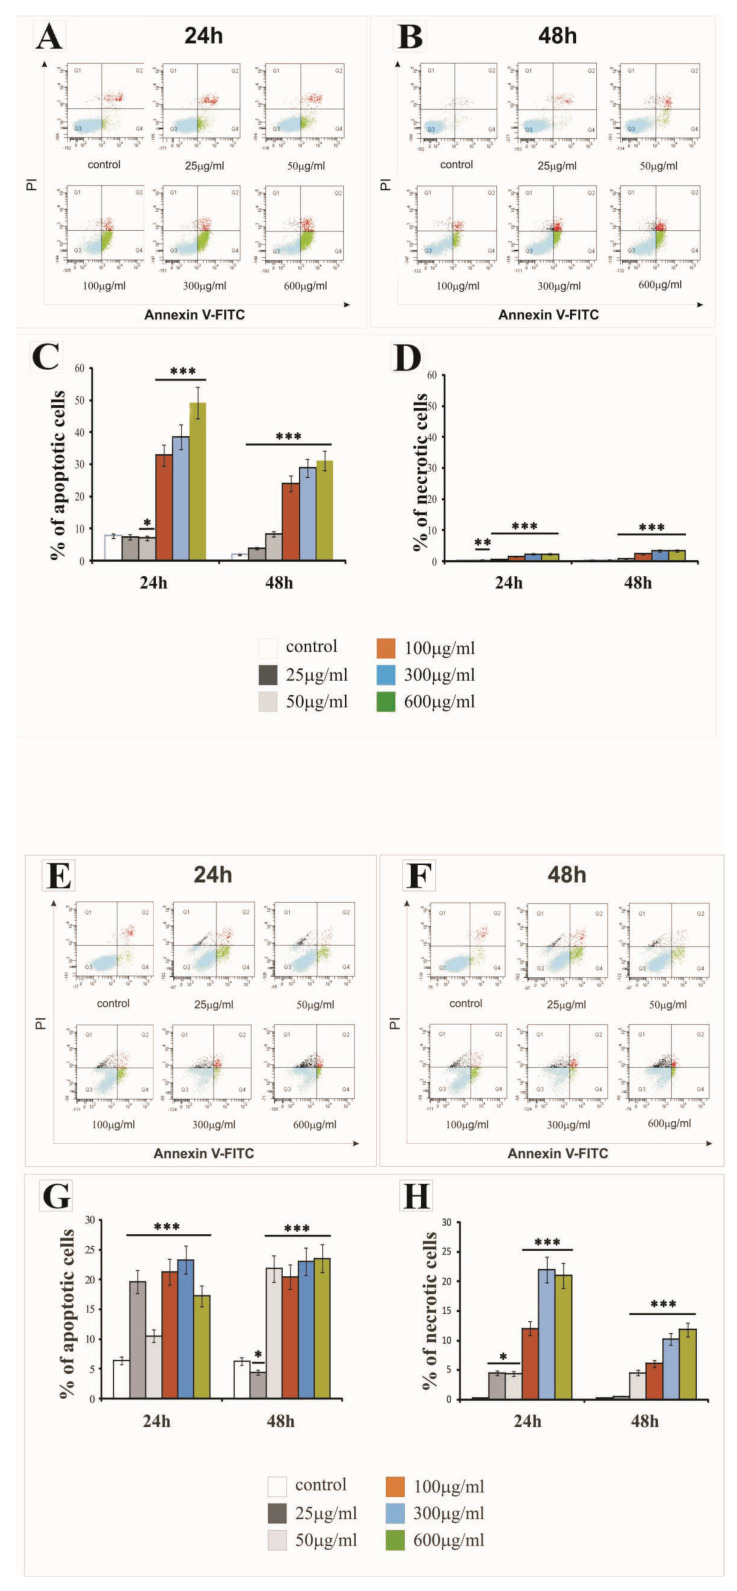
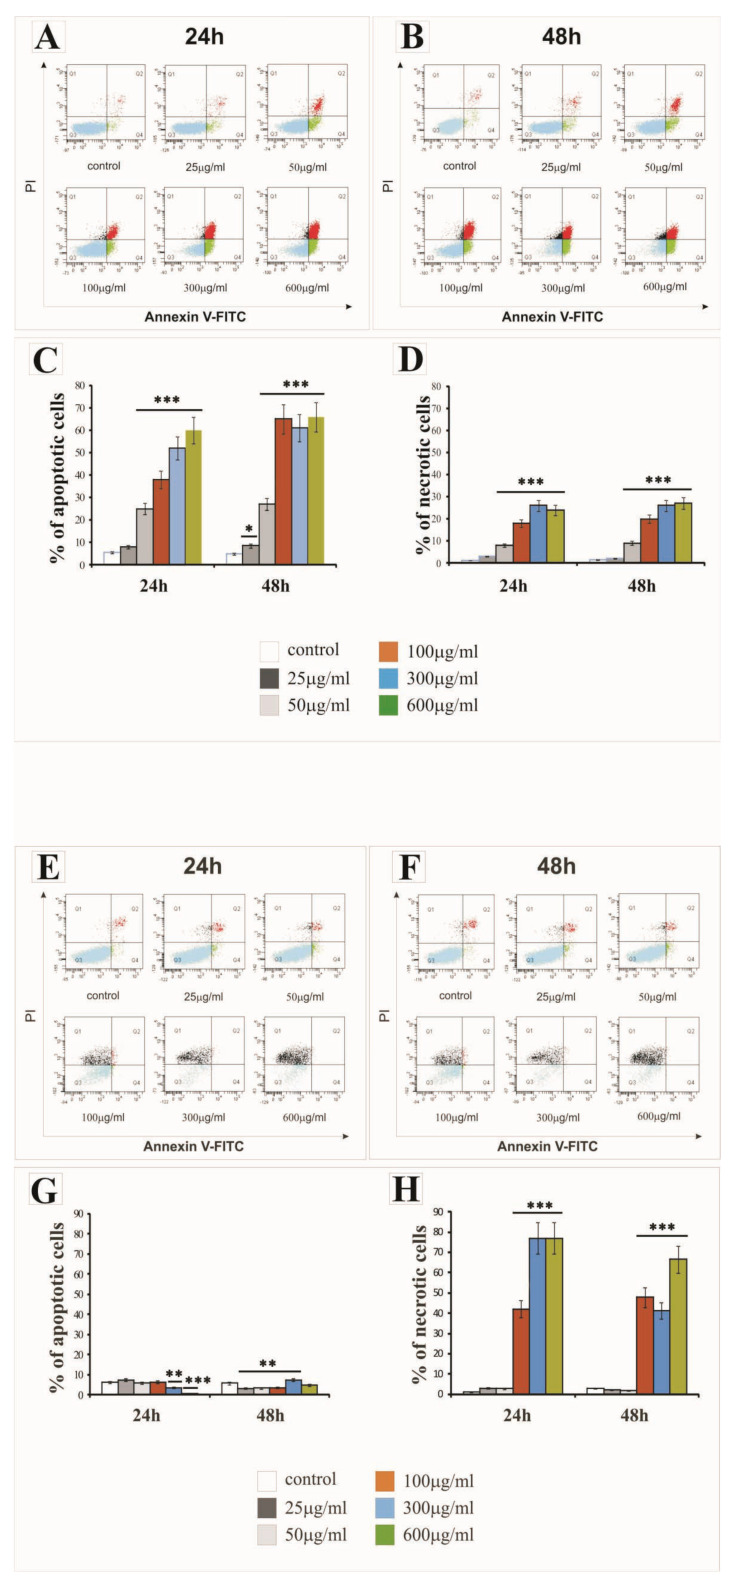
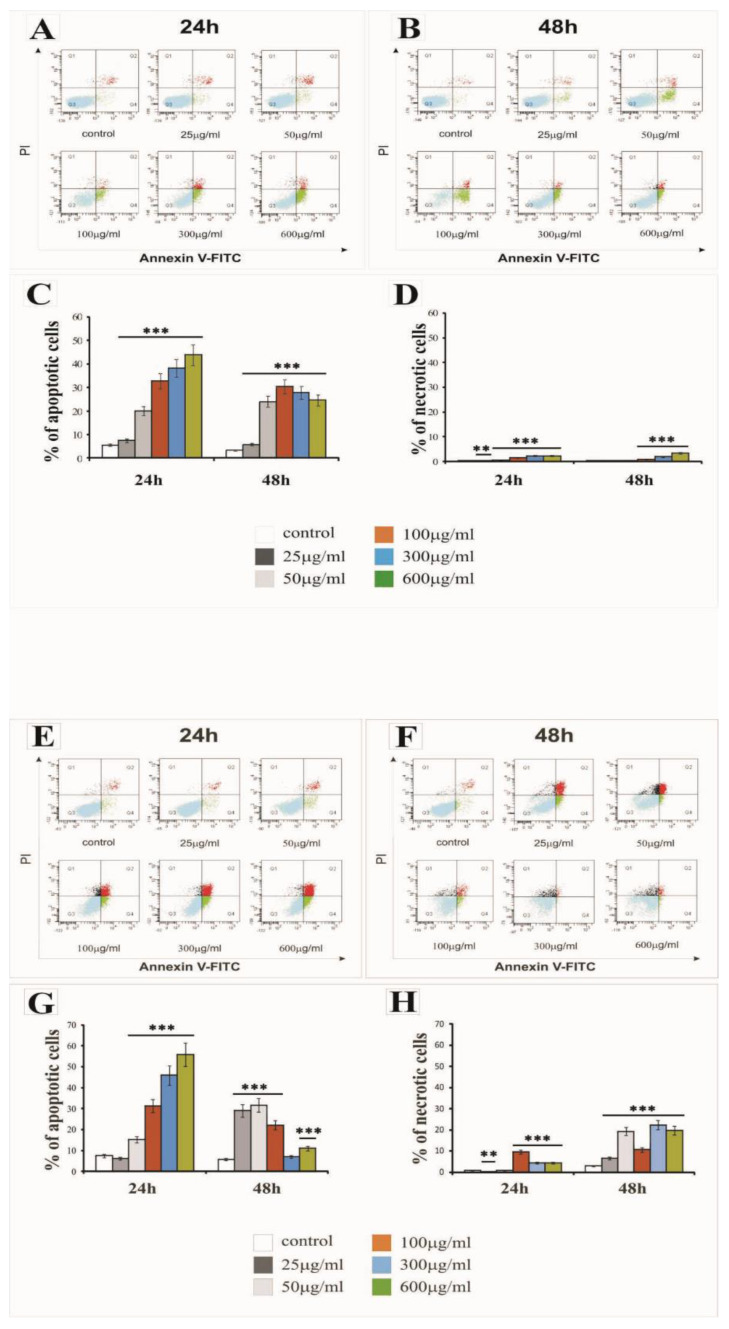
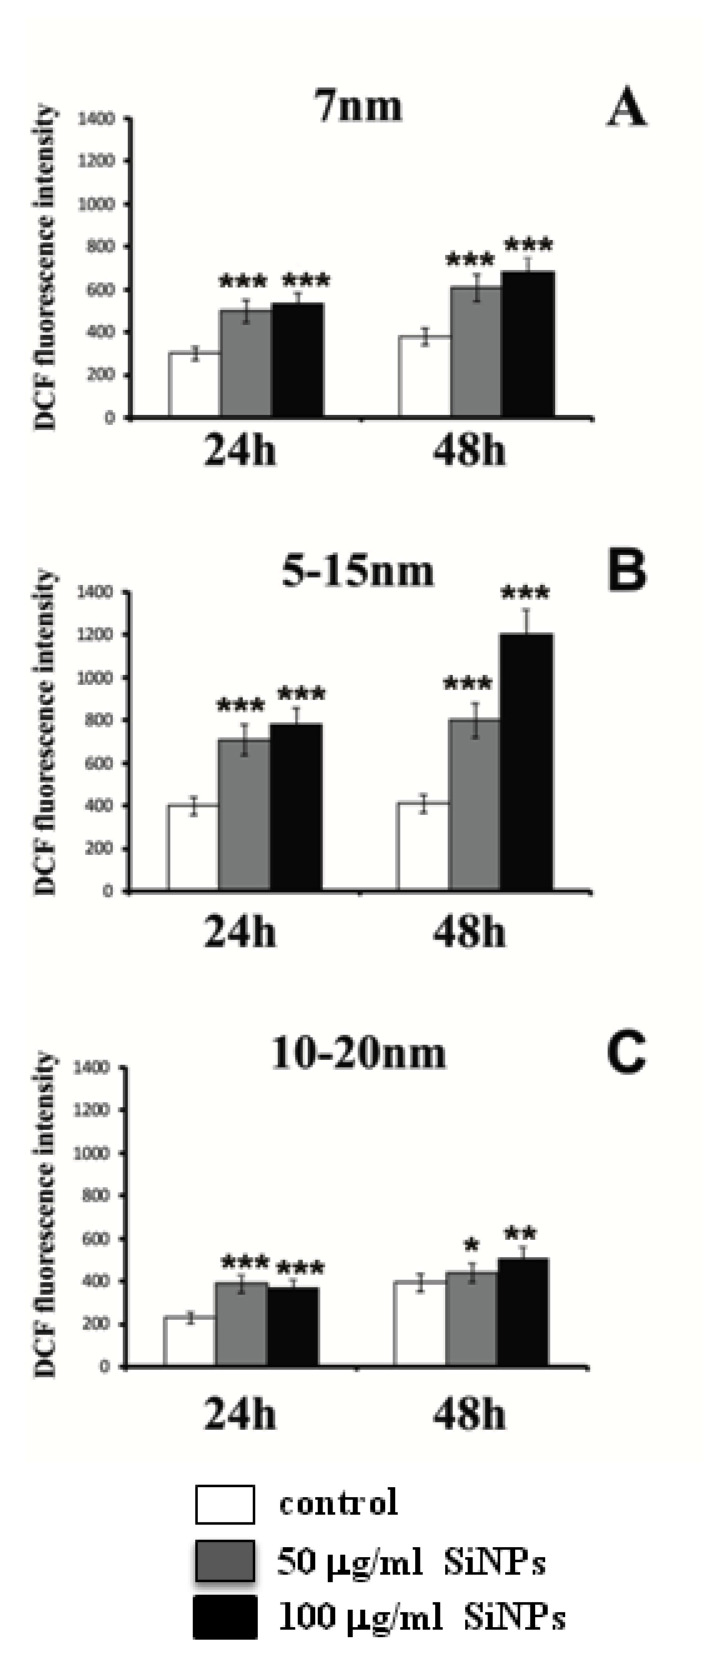
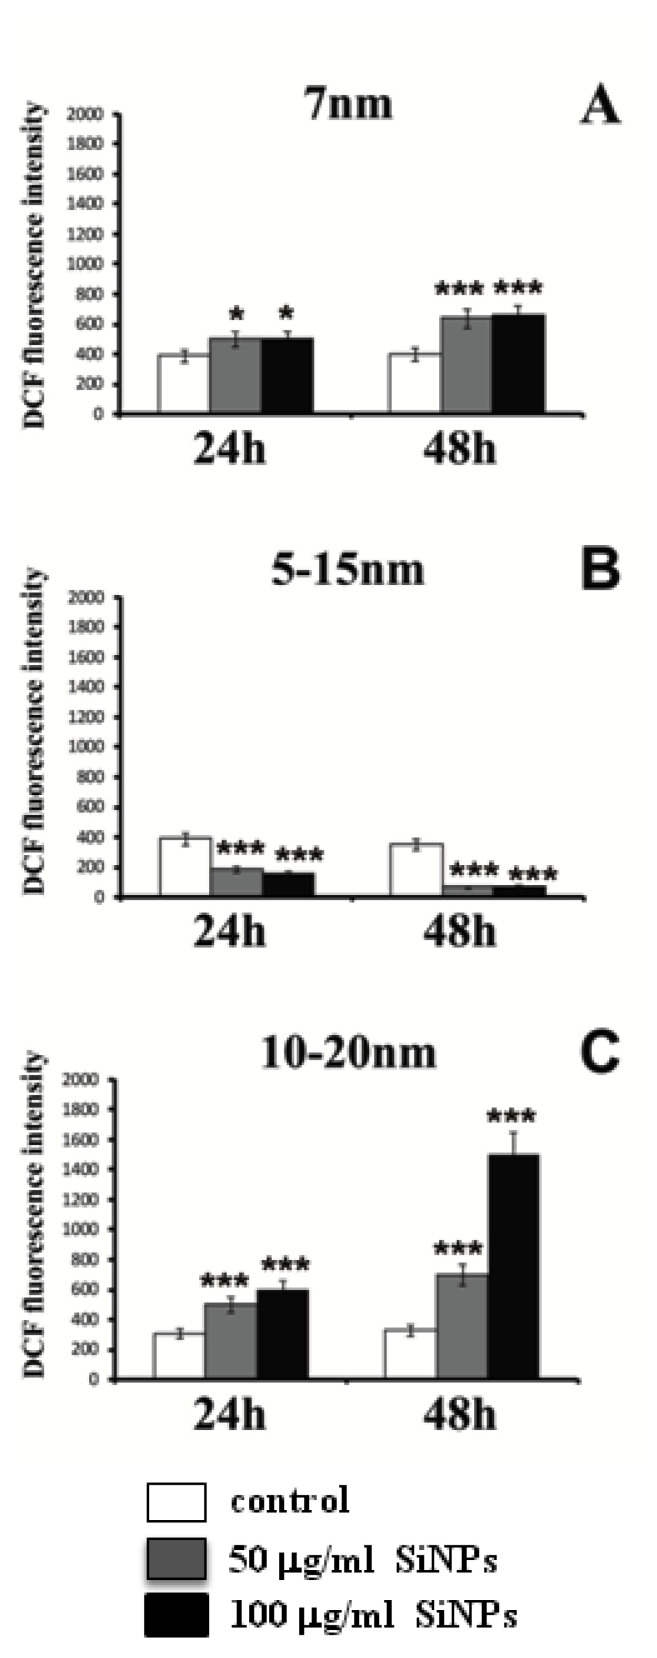
Despite intensive investigations, nanoparticle-induced cellular damage is an important problem that has not been fully elucidated yet. Here, we report that silica nanoparticles (SiNPs) demonstrated anticancer influence on glioblastoma cells by the induction of apoptosis or necrosis. These effects are highly cell type-specific, as well as dependent on the size and dose of applied nanoparticles. Exposure of LN-18 and LBC3 cells to different sizes of SiNPs-7 nm, 5-15 nm, or 10-20 nm-at dosages, ranging from 12.5 to 1000 µg/mL, for 24 and 48 h reduced the viability of these cells. Treatment of LN-18 and LBC3 cells with 7 nm or 10-20 nm SiNPs at doses ≥50 µg/mL caused a strong induction of apoptosis, which is connected with an increase of intracellular reactive oxygen species (ROS) production. The 5-15 nm SiNPs exhibited distinct behavior comparing to silica nanoparticles of other studied sizes. In contrast to LBC3, in LN-18 cells exposed to 5-15 nm SiNPs we did not observe any effect on apoptosis. These nanoparticles exerted only strong necrosis, which was connected with a reduction in ROS generation. This suggests that SiNPs can trigger different cellular/molecular effects, depending on the exposure conditions, the size and dose of nanoparticles, and cell type of glioblastoma.
Keywords: apoptosis; glioblastoma; nanotoxicity; silica nanoparticles.
Conflict of interest statement
The authors declare no conflict of interest.
Figures
Similar articles
-
Silica nanoparticle-induced oxidative stress and mitochondrial damage is followed by activation of intrinsic apoptosis pathway in glioblastoma cells.Int J Nanomedicine. 2018 Apr 12;13:2279-2294. doi: 10.2147/IJN.S158393. eCollection 2018. Int J Nanomedicine. 2018. PMID: 29695906 Free PMC article.
-
The Effects of Silica Nanoparticles on Apoptosis and Autophagy of Glioblastoma Cell Lines.Nanomaterials (Basel). 2017 Aug 21;7(8):230. doi: 10.3390/nano7080230. Nanomaterials (Basel). 2017. PMID: 28825685 Free PMC article.
-
Two distinct cellular pathways leading to endothelial cell cytotoxicity by silica nanoparticle size.J Nanobiotechnology. 2019 Feb 5;17(1):24. doi: 10.1186/s12951-019-0456-4. J Nanobiotechnology. 2019. PMID: 30722792 Free PMC article.
-
The toxicity of silica nanoparticles to the immune system.Nanomedicine (Lond). 2018 Aug 1;13(15):1939-1962. doi: 10.2217/nnm-2018-0076. Epub 2018 Aug 28. Nanomedicine (Lond). 2018. PMID: 30152253 Review.
-
Adverse effects and underlying mechanism of amorphous silica nanoparticles in liver.Chemosphere. 2023 Jan;311(Pt 1):136955. doi: 10.1016/j.chemosphere.2022.136955. Epub 2022 Oct 21. Chemosphere. 2023. PMID: 36280121 Review.
Cited by
-
Current Non-Metal Nanoparticle-Based Therapeutic Approaches for Glioblastoma Treatment.Biomedicines. 2024 Aug 11;12(8):1822. doi: 10.3390/biomedicines12081822. Biomedicines. 2024. PMID: 39200286 Free PMC article. Review.
-
Nanomedicine Approaches for Autophagy Modulation in Cancer Therapy.Small Sci. 2025 Apr 11;5(6):2400607. doi: 10.1002/smsc.202400607. eCollection 2025 Jun. Small Sci. 2025. PMID: 40529859 Free PMC article.
-
Silica nanoparticles alleviate the immunosuppression, oxidative stress, biochemical, behavioral, and histopathological alterations induced by Aeromonas veronii infection in African catfish (Clarias gariepinus).Fish Physiol Biochem. 2024 Apr;50(2):767-783. doi: 10.1007/s10695-023-01274-6. Epub 2023 Dec 7. Fish Physiol Biochem. 2024. PMID: 38060081 Free PMC article.
-
A Preliminary Study of the Effect of Quercetin on Cytotoxicity, Apoptosis, and Stress Responses in Glioblastoma Cell Lines.Int J Mol Sci. 2022 Jan 25;23(3):1345. doi: 10.3390/ijms23031345. Int J Mol Sci. 2022. PMID: 35163269 Free PMC article.
-
Nanoparticles for Glioblastoma Treatment.Pharmaceutics. 2025 May 23;17(6):688. doi: 10.3390/pharmaceutics17060688. Pharmaceutics. 2025. PMID: 40574001 Free PMC article. Review.
References
-
- Kavitha C.V., Jain A.K., Agarwal C., Pierce A., Keating A., Huber K.M., Serkova N.J., Wempe M.F., Agarwal R., Deep G. Asiatic acid induces endoplasmic reticulum stress and apoptotic death in glioblastoma multiforme cells both in vitro and in vivo. Mol. Carcinog. 2015;54:1417–1429. doi: 10.1002/mc.22220. - DOI - PMC - PubMed
MeSH terms
Substances
LinkOut - more resources
Full Text Sources
Other Literature Sources
