. 2021 Mar 30;22(7):3567.
doi: 10.3390/ijms22073567.

Growth and Viability of Cutaneous Squamous Cell Carcinoma Cell Lines Display Different Sensitivities to Isoform-Specific Phosphoinositide 3-Kinase Inhibitors

Affiliations

Growth and Viability of Cutaneous Squamous Cell Carcinoma Cell Lines Display Different Sensitivities to Isoform-Specific Phosphoinositide 3-Kinase Inhibitors

Viviana Mannella et al. Int J Mol Sci. .

Abstract

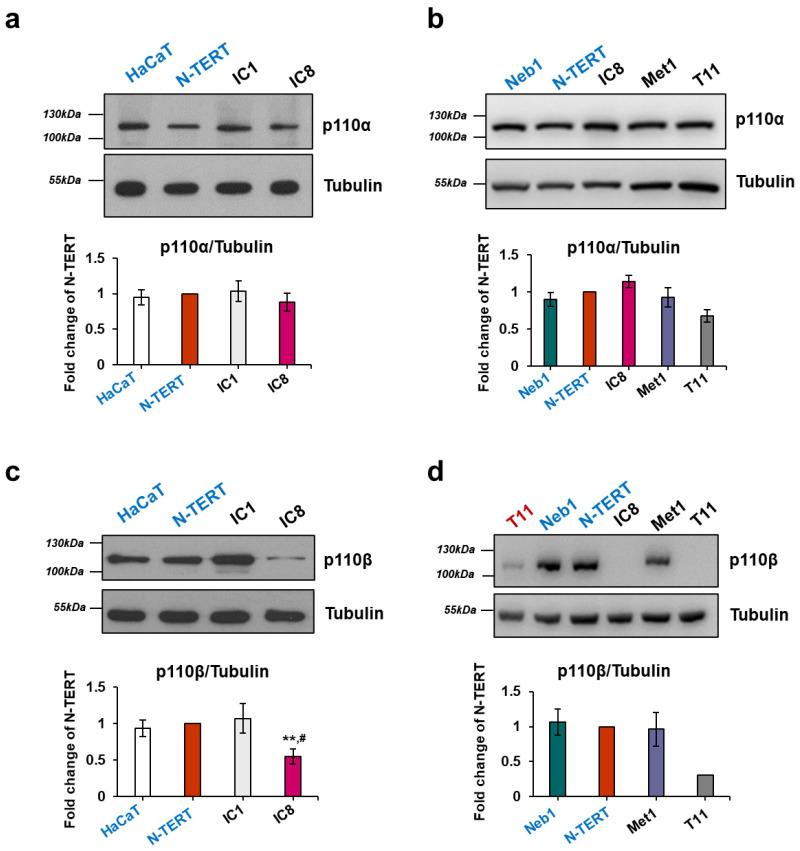
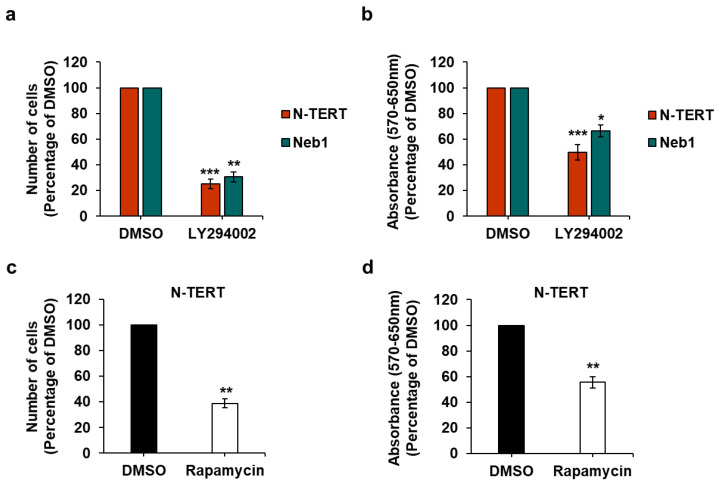
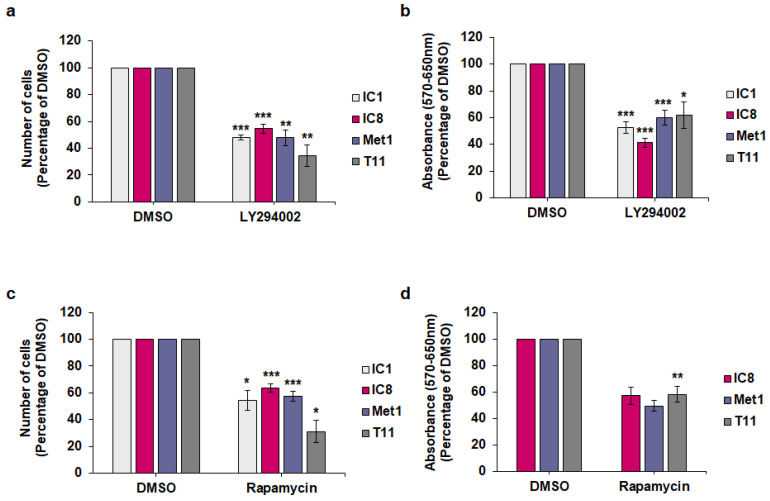
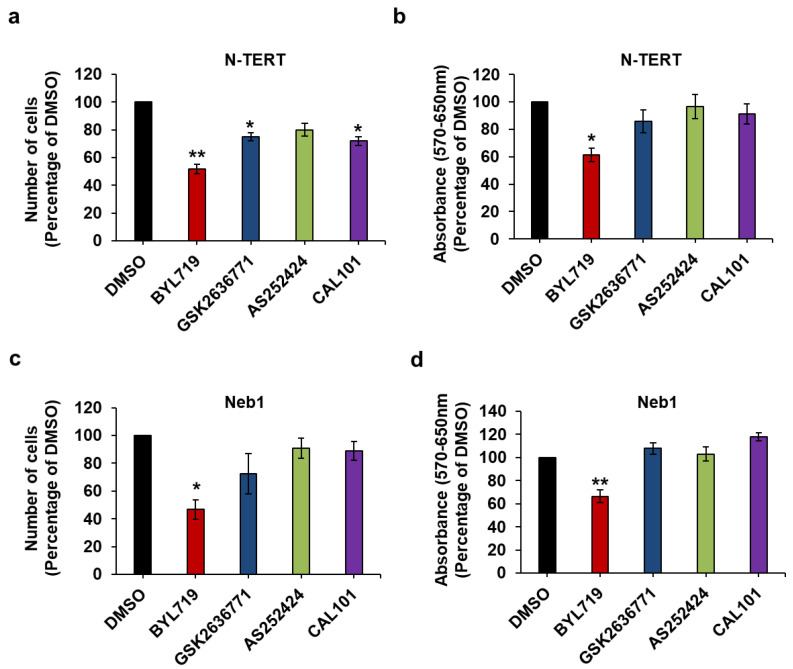
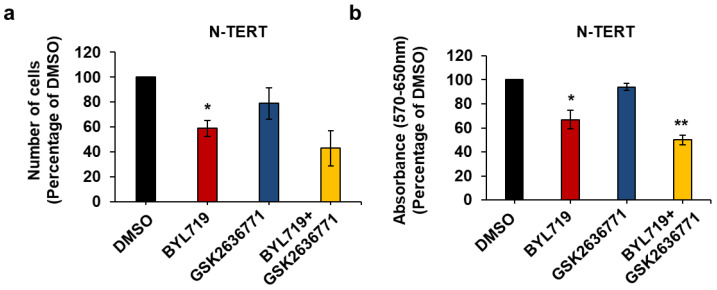
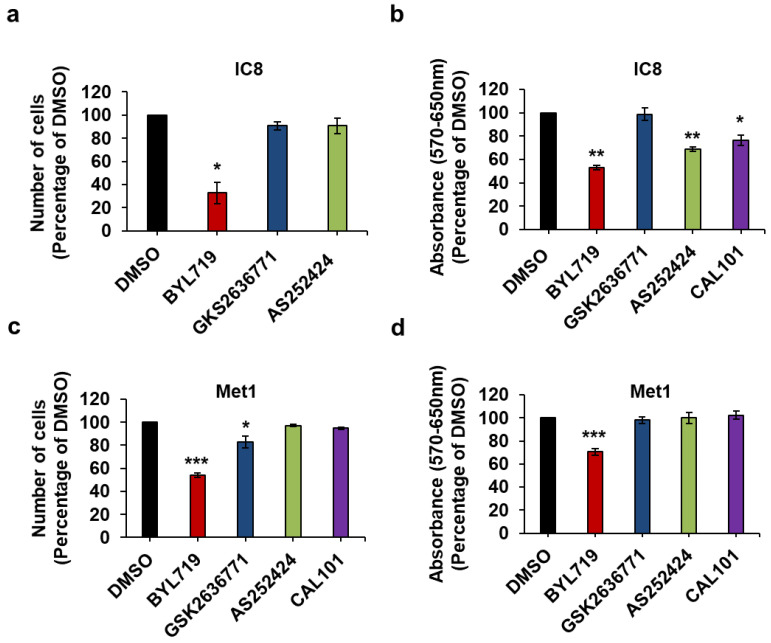
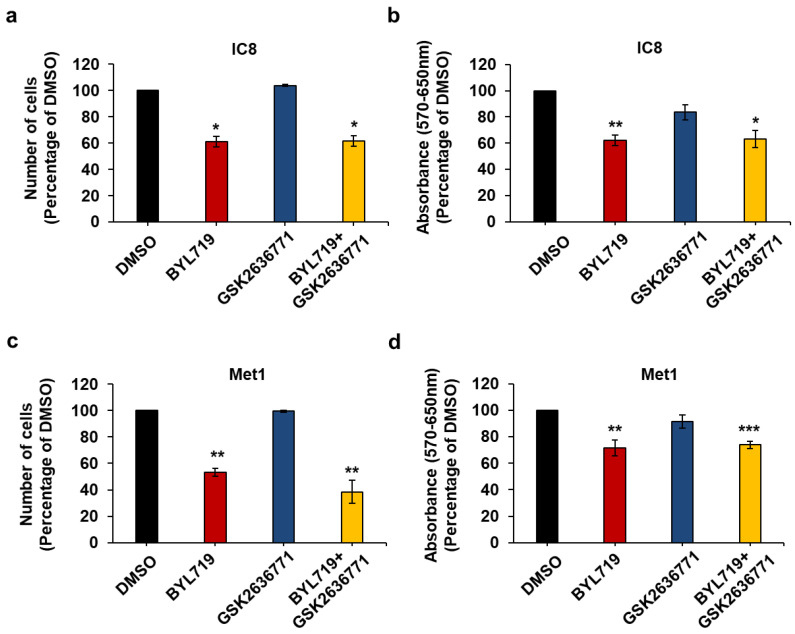
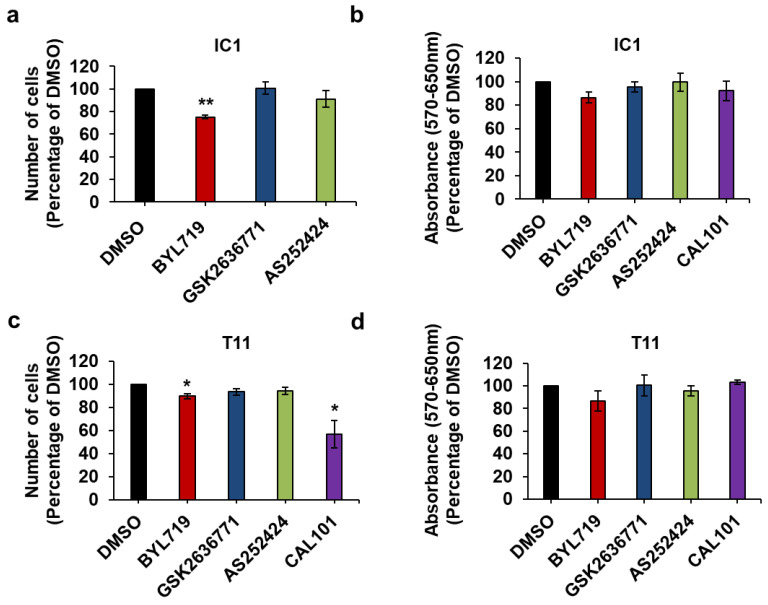
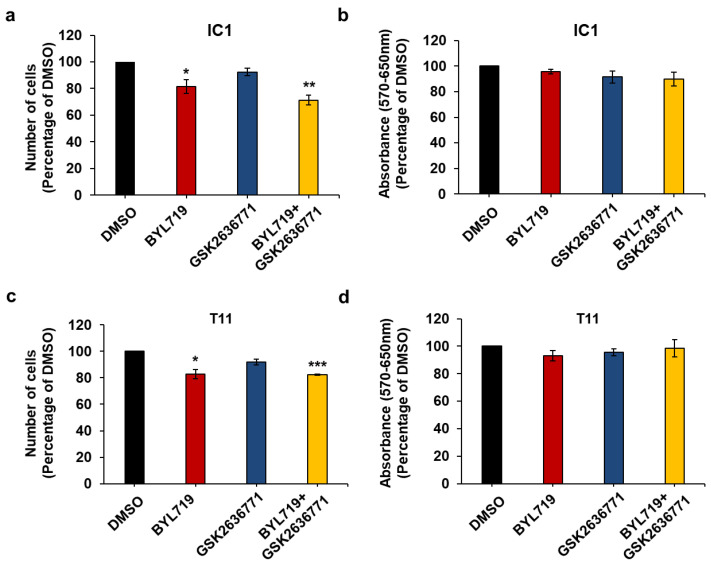
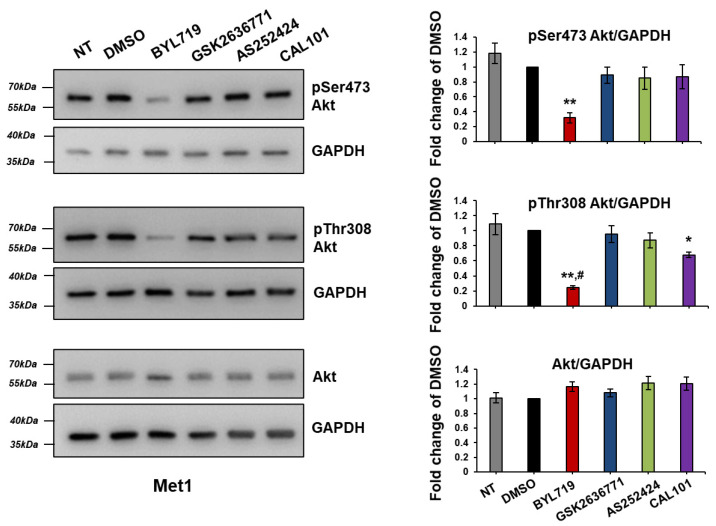
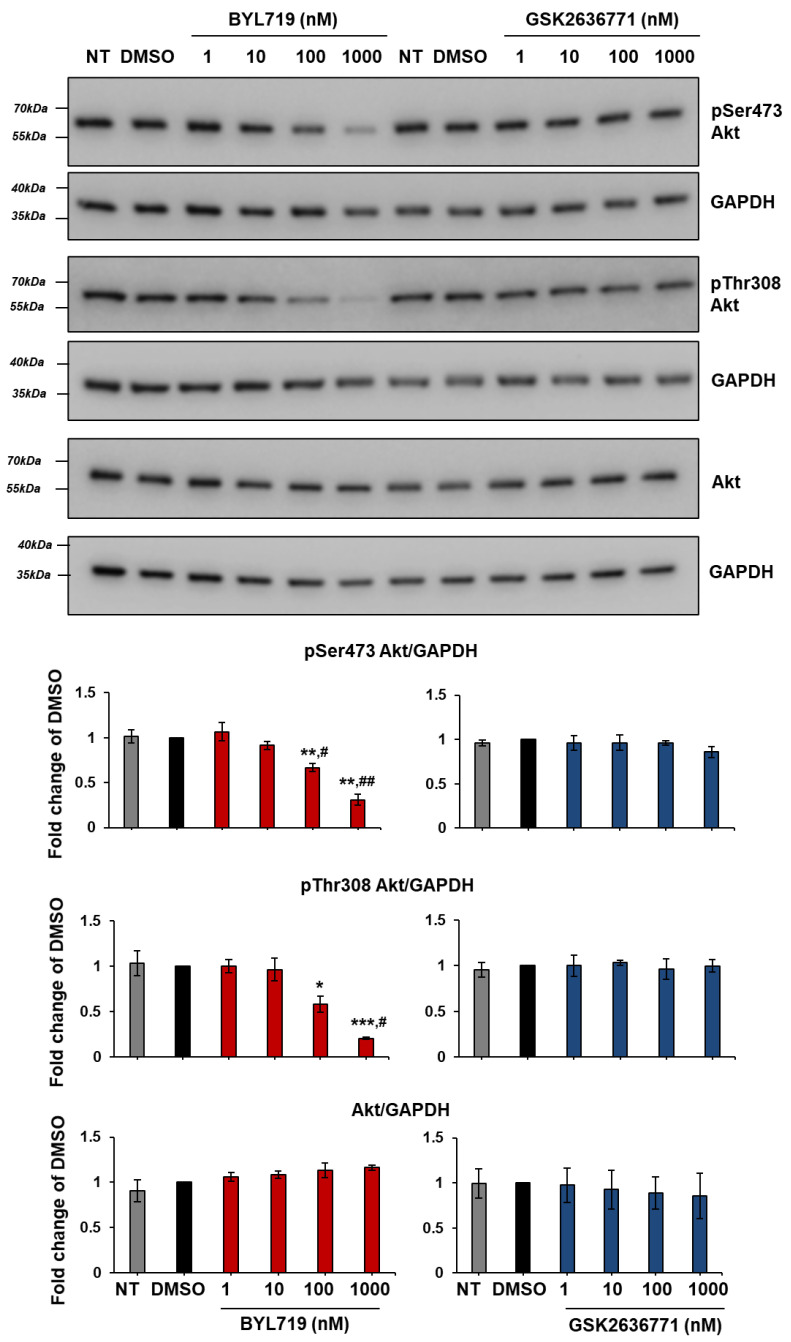
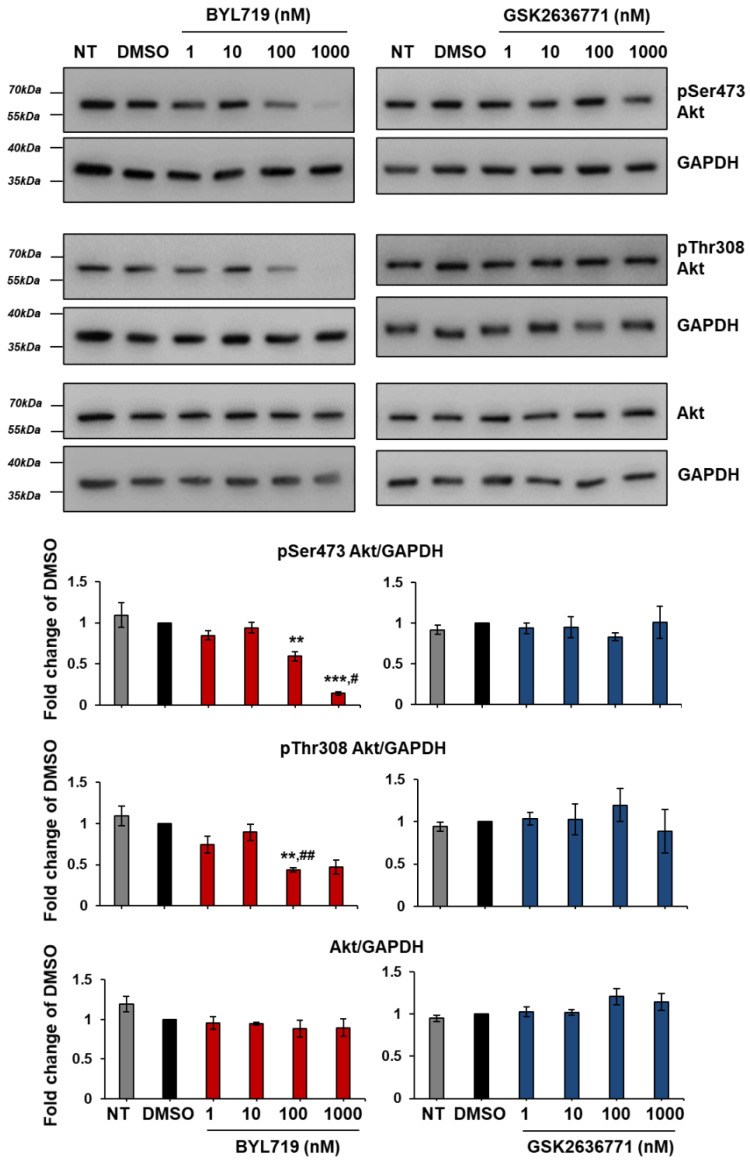
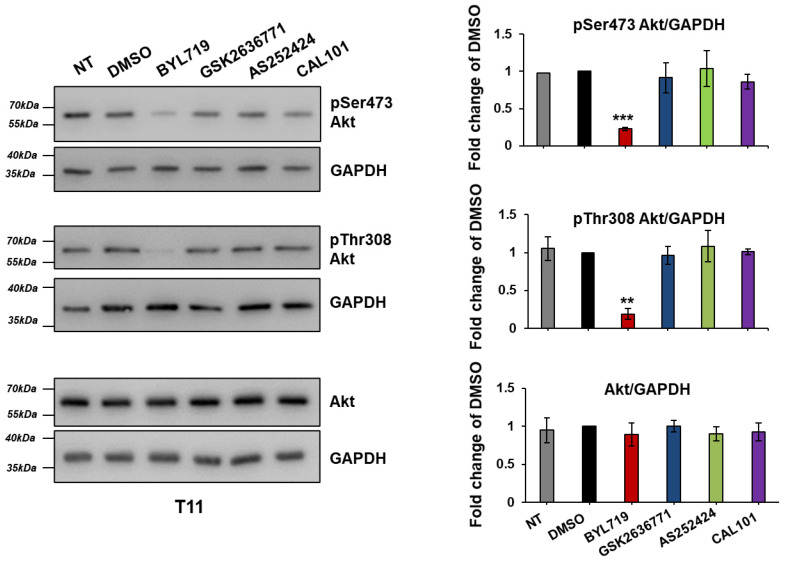
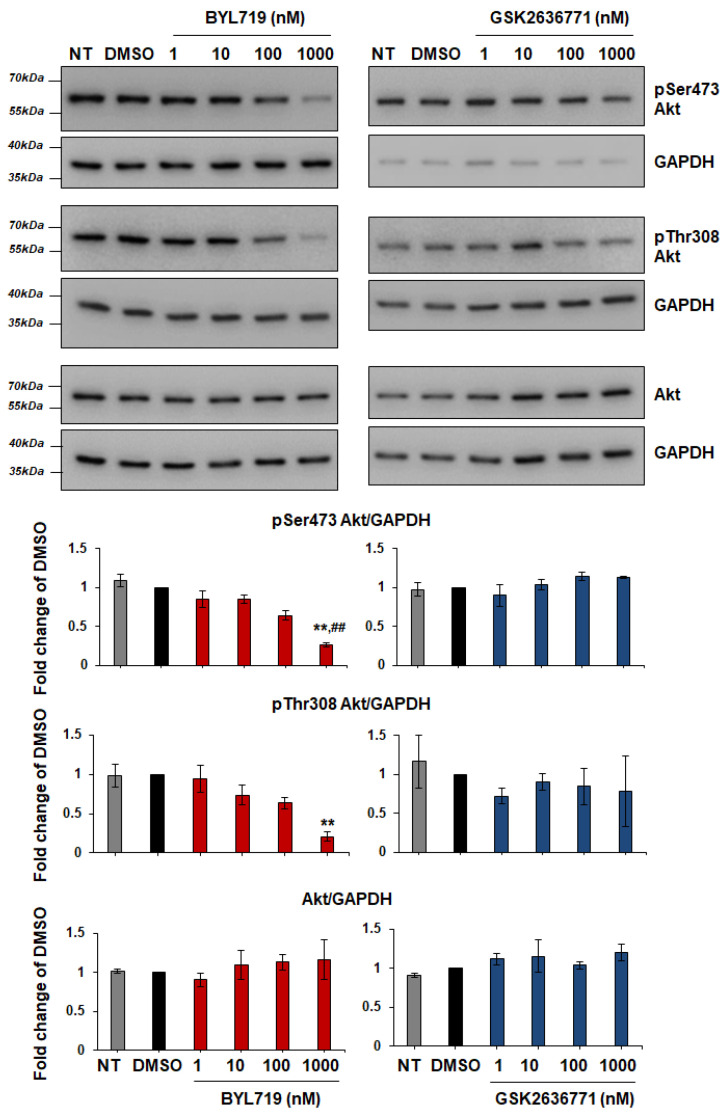
Cutaneous squamous cell carcinomas (cSCCs) account for about 20% of keratinocyte carcinomas, the most common cancer in the UK. Therapeutic options for cSCC patients who develop metastasis are limited and a better understanding of the biochemical pathways involved in cSCC development/progression is crucial to identify novel therapeutic targets. Evidence indicates that the phosphoinositide 3-kinases (PI3Ks)/Akt pathway plays an important role, in particular in advanced cSCC. Questions remain of whether all four PI3K isoforms able to activate Akt are involved and whether selective inhibition of specific isoform(s) might represent a more targeted strategy. Here we determined the sensitivity of four patient-derived cSCC cell lines to isoform-specific PI3K inhibitors to start investigating their potential therapeutic value in cSCC. Parallel experiments were performed in immortalized keratinocyte cell lines. We observed that pan PI3Ks inhibition reduced the growth/viability of all tested cell lines, confirming the crucial role of this pathway. Selective inhibition of the PI3K isoform p110α reduced growth/viability of keratinocytes and of two cSCC cell lines while affecting the other two only slightly. Importantly, p110α inhibition reduced Akt phosphorylation in all cSCC cell lines. These data indicate that growth and viability of the investigated cSCC cells display differential sensitivity to isoform-specific PI3K inhibitors.

Keywords: BYL719; cutaneous squamous cell carcinoma; isoform-specific PI3K inhibitors; mTOR; phosphoinositide 3-kinases.


Conflict of interest statement

The authors declare no conflict of interest. The funders had no role in the design of the study; in the collection, analyses, or interpretation of data; in the writing of the manuscript, or in the decision to publish the results.

Figures

Figure 1
Figure 1
Keratinocyte and cutaneous squamous cell carcinoma (cSCC) cell lines express class I phosphoinositide 3-kinase (PI3K) isoforms p110α and p110β. Immortalized keratinocytes (HaCaT, N-TERT and Neb1, labelled in blue) and cSCC cells (IC1, IC8, Met1 and T11) were lysed with 2% SDS and expression of the indicated class I PI3K isoforms was analyzed by Western blotting. Tubulin was used as loading control. Signals were visualized using X-ray films and a film processor (a,c) or using Chemidoc™ MP Imaging System (b,d). Representative blots are shown. Graphs indicate data from densitometry analysis for each enzyme, normalized to Tubulin and expressed as fold change of results from N-TERT cells. Data are means ± SEM from the following numbers of lysates, prepared independently from different batches of cells: n = 6 ((a), apart from IC1, n = 5), n = 3 (b), n = 6 (c) and n = 3 ((d), apart from T11, n = 1). Note that p110β was barely detectable and not quantifiable in IC8 cells using Chemidoc™ MP Imaging System (d) therefore densitometry analysis could not be performed for these cells in these experiments. Similarly, the band was detectable and quantifiable in only one of the T11 lysates in these conditions therefore only this set (labelled in red) was used for analysis in (d). See also Supplementary Figure S1d. ** p < 0.01 vs. N-TERT, # p < 0.05 vs. HaCaT.
Figure 2
Figure 2
The PI3K/Akt/mTOR pathway regulates growth and viability of keratinocytes. (a,b) N-TERT and Neb1 cells were treated with 10 µM LY294002 or vehicle alone (DMSO) in complete medium supplemented with 10% fetal bovine serum (FBS). (c,d) N-TERT cells were treated with 10 nM rapamycin in complete medium supplemented with 10% FBS. After 72 h, number of cells was assessed by cell counting (a,c) and cell viability was assessed by MTT assays (b,d). Data are expressed as percentage of results from cells treated with DMSO and are means ± SEM from n = 6 ((a,b), N-TERT), n = 3 ((a,b), Neb1), n = 3 (c) and n = 4 (d) independent experiments performed in duplicate (a,c) or triplicate (b,d). * p < 0.05, ** p < 0.01, *** p < 0.001 vs. DMSO.
Figure 3
Figure 3
The PI3K/Akt/mTOR pathway regulates growth and viability of cSCC cell lines. The indicated cSCC cell lines were treated with 10 µM LY294002 (a,b) or 10 nM rapamycin (c,d) in complete medium supplemented with 10% FBS. Control cells were treated with vehicle alone (DMSO). After 72 h, number of cells was assessed by cell counting (a,c) and cell viability was assessed by MTT assays (b,d). Data are expressed as percentage of results from control cells and are means ± SEM from n = 4 ((a), IC1, IC8, Met1), n = 7 ((a), IC1); n = 5 ((b), IC8), n = 7 ((b), Met1), n = 4 ((b), T11), n = 10 ((b), IC1); n = 3 ((c), IC1,T11), n = 6 ((c), Met1), n = 9 ((c), IC8); n = 2 ((d), IC8, Met1) and n = 3 ((d), T11) independent experiments performed in duplicate (a,c) or triplicate (b,d). * p < 0.05, ** p < 0.01, *** p < 0.001 vs. DMSO.
Figure 4
Figure 4
The p110α inhibitor BYL719 is the most effective in reducing both cell numbers and viability of keratinocytes. N-TERT (a,b) and Neb1 (c,d) cells were treated with 1 µM of the indicated inhibitors or vehicle (DMSO) in complete medium supplemented with 10% FBS. After 72 h, number of cells was assessed by cell counting (a,c) and cell viability was assessed by MTT assays (b,d). Data are expressed as percentage of results from cells treated with DMSO and are means ± SEM from n = 3 (a), n = 3 (b), n = 3 (c) and n = 4 (d) independent experiments performed in duplicate (a,c) or triplicate (b,d). * p < 0.05, ** p < 0.01 vs. DMSO.
Figure 5
Figure 5
p110β does not play a major role in N-TERT growth and viability upon p110α inhibition. N-TERT cells were treated with 1 µM of the indicated inhibitors alone or in combination in complete medium supplemented with 10% FBS. Control cells were treated with DMSO. After 72 h, number of cells was assessed by cell counting (a) and cell viability was assessed by MTT assays (b). Data are expressed as percentage of results from control cells and are means ± SEM from n = 3 (a) and n = 4 (b) independent experiments performed in duplicate (a) or triplicate (b). * p < 0.05, ** p < 0.01 vs. DMSO.
Figure 6
Figure 6
The p110α inhibitor BYL719 is the most effective in reducing IC8 and Met1 cell numbers and viability. IC8 (a,b) and Met1 (c,d) cells were treated with 1 µM of the indicated inhibitors or vehicle (DMSO) in complete medium supplemented with 10% FBS. After 72 h, number of cells was assessed by cell counting (a,c) and cell viability was assessed by MTT assays (b,d). Data are expressed as percentage of results from cells treated with DMSO and are means ± SEM from n = 3 ((a), apart from AS252424, n = 6), n = 3 (b), n = 5 ((c), apart from GSK2636771, n = 4) and n = 5 (d) independent experiments performed in duplicate (a,c) or triplicate (b,d). * p < 0.05, ** p < 0.01, *** p < 0.001 vs. DMSO.
Figure 7
Figure 7
p110β does not contribute to IC8 and Met1 cell growth and viability upon p110α inhibition. IC8 (a,b) and Met1 (c,d) cells were treated with 1 µM of the indicated inhibitors alone or in combination in complete medium supplemented with 10% FBS. Control cells were treated with DMSO. After 72 h, number of cells was assessed by cell counting (a,c) and cell viability was assessed by MTT assays (b,d). Data are expressed as percentage of results from control cells and are means ± SEM (apart from (c), means ± SD) from n = 3 (a), n = 4 (b), n = 3 ((c), apart from GSK2636771, n = 2) and n = 6 (d) independent experiments performed in duplicate (a,d) or triplicate (b,d). * p < 0.05, ** p < 0.01, *** p < 0.001 vs. DMSO.
Figure 8
Figure 8
IC1 and T11 cells are more resistant to treatment with isoform-specific PI3K inhibitors than IC8 and Met1 cells. IC1 (a,b) and T11 (c,d) cells were treated with 1 µM of the indicated inhibitors or vehicle (DMSO) in complete medium supplemented with 10% FBS. After 72 h, number of cells was assessed by cell counting (a,c) and cell viability was assessed by MTT assays (b,d). Data are expressed as percentage of results from cells treated with DMSO and are means ± SEM from n = 3 ((a), apart from AS252424, n = 4), n = 4 ((b), apart from CAL101 n = 3), n = 4 ((c), apart from CAL101 n = 5) and n = 4 ((d), apart from AS252424 and CAL101 n = 3) independent experiments performed in duplicate (a,c) or triplicate (b,d). * p < 0.05, ** p < 0.01 vs. DMSO.
Figure 9
Figure 9
p110β does not compensate for p110α inhibition in IC1 and T11 cells. IC1 (a,b) and T11 (c,d) cells were treated with 1 µM of the indicated inhibitors alone or in combination in complete medium supplemented with 10% FBS. Control cells were treated with DMSO. After 72 h, number of cells was assessed by cell counting (a,c) and cell viability was assessed by MTT assays (b,d). Data are expressed as percentage of results from control cells and are means ± SEM from n = 4 (a), n = 7 (b) and n = 3 (c,d) independent experiments performed in duplicate (a,c) or triplicate (b,d). * p < 0.05, ** p < 0.01, *** p < 0.001.
Figure 10
Figure 10
BYL719 inhibits Akt phosphorylation in Met1 cells. Met1 cells were treated with 1 µM of the isoform-specific inhibitors in complete medium supplemented with 10% FBS. Control cells were treated with DMSO or left untreated (NT). Cells were lysed after 1 h and Akt phosphorylation at residues Ser473 and Thr308 as well as total levels of Akt were determined by Western blotting. Glyceraldehyde 3-phosphate dehydrogenase (GAPDH) was used as loading control. Signals were visualized using Chemidoc™ MP Imaging System. Graphs indicate results from densitometry analysis of phosphorylated or total Akt normalized to loading control and expressed as fold change of results from DMSO-treated cells. Data are means ± SEM from n = 3 independent experiments (apart from NT in pSer437 Akt graph, n = 2). * p < 0.05, ** p < 0.01 vs. DMSO; # p < 0.05 vs. NT.
Figure 11
Figure 11
BYL719 inhibits Akt phosphorylation in Met1 cells in a dose-dependent manner. Met1 cells were treated with the indicated concentrations of BYL719 and GSK2636771 in complete medium supplemented with 10% FBS. Control cells were treated with DMSO or left untreated (NT). After 1 h, cells were Lysed and lysates were analyzed by Western blotting. GAPDH was used as loading control. Signals were visualized using Chemidoc™ MP Imaging System. Graphs indicate results from densitometry analysis of phosphorylated or total Akt normalized to loading control and expressed as fold change of results from DMSO-treated cells. Data are means ± SEM from n = 3 independent experiments (apart from data from cells treated with BYL719 1 nM, 10 nM and 100 nM, n = 4) * p < 0.05, ** p < 0.01, *** p < 0.001 vs. DMSO; # p < 0.05, ## p < 0.01 vs. NT.
Figure 12
Figure 12
BYL719 inhibits Akt phosphorylation in IC8 cells in a dose-dependent manner. IC8 cells were left untreated (NT) or treated for 1 h with increasing concentrations of BYL719 and GSK2636771 in complete medium supplemented with 10% FBS. Control cells were treated with DMSO. Phosphorylation status and total levels of Akt were analyzed by Western blotting. GAPDH was used as loading control. Signals were visualized using Chemidoc™ MP Imaging System. Graphs show results from densitometry analysis of phosphorylated or total Akt normalized to loading control and expressed as fold change of results from DMSO-treated cells. Only blots showing clearly detectable bands were used for densitometry analysis. Data are means ± SEM from the following numbers of independent experiments: pSer473 Akt, n = 4 (apart from NT in BYL719 graph and from BYL719 1 nM, BYL719 10 nM and GSK2636771 100 nM, n = 3); pThr308 Akt, n = 4 (apart from BYL719 1 nM, 10 nM and 100 nM, n = 3 and BYL719 1 µM, n = 2); Akt, n = 4 (apart from NT, n = 3); ** p < 0.01, *** p < 0.001 vs. DMSO; # p < 0.05, ## p < 0.01 vs. NT.
Figure 13
Figure 13
T11 cells were left untreated (NT) or treated with 1 µM of the isoform-specific inhibitors or DMSO in complete medium supplemented with 10% FBS. After 1 h, cells were Lysed and lysates were analyzed Western blotting. GAPDH was used as loading control. Signals were visualized using Chemidoc™ MP Imaging System. Graphs indicate results from densitometry analysis of phosphorylated or total Akt normalized to loading control and expressed as fold change of results from DMSO-treated cells. Data are means ± SEM from the following numbers of independent experiments: pSer473 Akt, n = 3 (apart from NT, n = 1 and BYL719, n = 2); pThr308 Akt and total Akt, n = 3 (apart from NT, n = 2). ** p < 0.01, *** p < 0.001 vs. DMSO.
Figure 14
Figure 14
BYL719 inhibits Akt phosphorylation in T11 cells in a dose-dependent manner. T11 cells were treated for 1 h with increasing concentrations of BYL719 and GSK2636771 in complete medium supplemented with 10% FBS. Control cells were left untreated (NT) or treated with DMSO. Phosphorylation and total levels of Akt were analyzed by Western blotting, with GAPDH used as loading control. Signals were visualized using Chemidoc™ MP Imaging System. Graphs show results from densitometry analysis of phosphorylated or total Akt normalized to loading control and expressed as fold change of results from DMSO-treated cells. Data are means ± SEM from the following numbers of independent experiments: pSer473 Akt, n = 3 (apart from GSK2636771 1 µM, n = 2); pThr308 Akt, n = 3 (apart from NT in BYL719 graph and GSK2636771 1 µM, n = 2); Akt, n = 3 (apart from NT in BYL719 graph and GSK2636771 100 nM and 1 µM, n = 2); ** p < 0.01 vs. DMSO; ## p < 0.01 vs. NT.

Similar articles

Cited by

References

    1. Venables Z., Nijsten T., Wong K., Autier P., Broggio J., Deas A., Harwood C., Hollestein L., Langan S., Morgan E., et al. Epidemiology of basal and cutaneous squamous cell carcinoma in the U.K. 2013–15: A cohort study. Br. J. Dermatol. 2019;181:474–482. doi: 10.1111/bjd.17873. - DOI - PMC - PubMed
    1. Blanpain C., Fuchs E. Epidermal homeostasis: A balancing act of stem cells in the skin. Nat. Rev. Mol. Cell Biol. 2009;10:207–217. doi: 10.1038/nrm2636. - DOI - PMC - PubMed
    1. Nagarajan P., Asgari M.M., Green A.C., Guhan S.M., Arron S.T., Proby C.M., Rollison D.E., Harwood C.A., Toland A.E. Keratinocyte Carcinomas: Current Concepts and Future Research Priorities. Clin. Cancer Res. 2019;25:2379–2391. doi: 10.1158/1078-0432.CCR-18-1122. - DOI - PMC - PubMed
    1. Burton K.A., Ashack K.A., Khachemoune A. Cutaneous Squamous Cell Carcinoma: A Review of High-Risk and Metastatic Disease. Am. J. Clin. Dermatol. 2016;17:491–508. doi: 10.1007/s40257-016-0207-3. - DOI - PubMed
    1. Harwood A.C., Proby C.M., Inman G.J., Leigh I.M. The Promise of Genomics and the Development of Targeted Therapies for Cutaneous Squamous Cell Carcinoma. Acta Derm. Venereol. 2016;96:3–16. doi: 10.2340/00015555-2181. - DOI - PubMed

MeSH terms

LinkOut - more resources