. 2021 Mar 30;18(7):3572.
doi: 10.3390/ijerph18073572.

Prevalence and Risk Factors of Infection in the Representative COVID-19 Cohort Munich

Affiliations

Prevalence and Risk Factors of Infection in the Representative COVID-19 Cohort Munich

Michael Pritsch et al. Int J Environ Res Public Health. .

Abstract

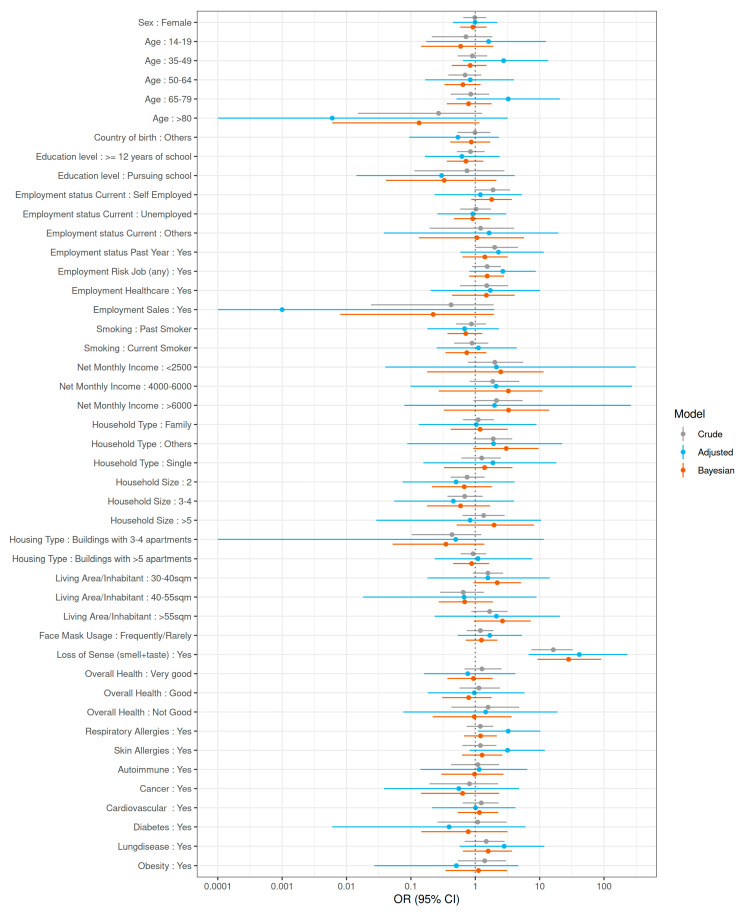
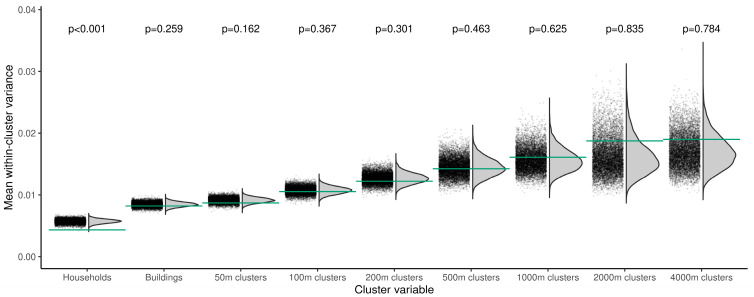
Given the large number of mild or asymptomatic SARS-CoV-2 cases, only population-based studies can provide reliable estimates of the magnitude of the pandemic. We therefore aimed to assess the sero-prevalence of SARS-CoV-2 in the Munich general population after the first wave of the pandemic. For this purpose, we drew a representative sample of 2994 private households and invited household members 14 years and older to complete questionnaires and to provide blood samples. SARS-CoV-2 seropositivity was defined as Roche N pan-Ig ≥ 0.4218. We adjusted the prevalence for the sampling design, sensitivity, and specificity. We investigated risk factors for SARS-CoV-2 seropositivity and geospatial transmission patterns by generalized linear mixed models and permutation tests. Seropositivity for SARS-CoV-2-specific antibodies was 1.82% (95% confidence interval (CI) 1.28-2.37%) as compared to 0.46% PCR-positive cases officially registered in Munich. Loss of the sense of smell or taste was associated with seropositivity (odds ratio (OR) 47.4; 95% CI 7.2-307.0) and infections clustered within households. By this first population-based study on SARS-CoV-2 prevalence in a large German municipality not affected by a superspreading event, we could show that at least one in four cases in private households was reported and known to the health authorities. These results will help authorities to estimate the true burden of disease in the population and to take evidence-based decisions on public health measures.

Keywords: COVID-19; SARS-CoV-2; infection fatality ratio; population-based cohort study; seroprevalence; underreporting.


Conflict of interest statement

F.F., T.F., D.M., L.O. and V.T. report grants from the Bavarian State Ministry of Science and the Arts during the conduct of the study. T.F. reports grants from the University Hospital of LMU Munich, Helmholtz Center Munich, University of Bonn, University of Bielefeld, and German Ministry for Education and Research during the conduct of the study. J.H. reports grants from the German Federal Ministry of Education and Research during the conduct of the study. M.H. and A.W. report personal fees and non-financial support, L.O. and M.P. report non-financial support from Roche Diagnostics. M.H., L.O., M.P. and A.W. report non-financial support from Euroimmun, Viramed, and Mikrogen. M.H., M.P. and A.W. report grants, non-financial support, and other from German Center for Infection Research (DZIF). F.F., M.H., L.O., M.P., V.T. and A.W. report grants and non-financial support from the Government of Bavaria. M.H., L.O., M.P., and A.W. report non-financial support from BMW, Mercedes Benz, Munich Police, and Accenture. M.H. and A.W. report personal fees and non-financial support from Box Betrobox during the conduct of the study. L.O. and M.P. report non-financial support from Box Betrobox. M.H. and A.W. have a patent Sample System for Sputum Diagnostics of SARS-CoV-2 pending. D.M. reports to be a sub-investigator on a phase I SARS-CoV-2 vaccine trial and on a phase I rabies vaccine trial, both sponsored by CureVac AG. M.P. and A.W. report non-financial support from Becker MVZ. V.T. reports support from CureVac AG outside the submitted work. A.W. reports personal fees and other from Haeraeus Sensors. A.W. reports non-financial support from Bruker Daltronics outside the submitted work. A.W. is involved in other different patents and companies not in relation with the serology of SARS-CoV-2. All other authors report nothing to disclose.

Code Availability: To facilitate reproducibility and reuse, we made the code used to perform the analyses and generate the figures available on GitHub (https://github.com/koco19/lab_epi (accessed on 28 March 2021)), and it has been uploaded to ZENODO (http://doi.org/10.5281/zenodo.4300922 (accessed on 28 March 2021)) for long-term storage.

Figures

Figure 1
Figure 1
Selection procedure and geospatial distribution of the study population. (A) The municipality of Munich together with its districts (distinguished by different colors). The 100 selected start constituencies for the random walks are marked in the same color as the respective constituency but in a darker shade. (B) All 2994 included households and their respective 368 constituencies. (C) Average number of recruited households per building by constituency. (D) Average number of members per recruited household by constituency.
Figure 2
Figure 2
Flow chart on participant selection for the KoCo19 baseline survey.
Figure 3
Figure 3
Dynamics of the COVID-19 pandemic and of the KoCo19 study in Munich since the beginning of the pandemic to the end of the KoCo19 study period. (A) Official weekly absolute number of newly diagnosed COVID-19 cases based on positive PCR tests. (B) Weekly number of participants recruited to the KoCo19 study. (C) Estimated underreporting factor depending on the percentage of reported cases in private households with respect to all reported cases in Munich. (D) Cumulative weekly number of officially registered COVID-19 infections in Munich. (E) Numbers of Elecsys Anti-SARS-CoV-2 Roche anti-N pan-Ig (Ro-N-Ig) seropositive samples per week (blue) divided by the number of blood draws in the respective time frame. 95% CIs (blue dashed lines) are based on an approximate Poisson assumption. Black line and shaded area indicate the weighted and adjusted prevalence estimate with 95% CI. Due to low recruitment numbers in the last week, in (D,E), the data from the last week were integrated with the pre-last week. (F) Estimated infection fatality ratio depending on the percentage of reported COVID-19-related deaths in private households with respect to all reported COVID-19-related deaths in Munich. (G) Weekly number of deaths in Munich for 2016–2020 in terms of official numbers. (H) Weekly excess mortality in 2020 compared to 2016–2019 in terms of official death counts and official SARS-CoV-2-related deaths. (I) Comparison of total number of deaths in terms of excess mortality and registered SARS-CoV-2-related deaths.
Figure 4
Figure 4
Risk factor analysis for SARS¬CoV-2 seropositivity. Risk factor analysis for SARS¬CoV-2 seropositivity in the KoCo19 study population comparing crude, adjusted for clustering, and Bayesian (after imputation and adjusted for clustering) estimates. All odds ratios (ORs) and 95% CIs were adjusted for age (continuous scale) and sex. OR: odds ratio; 95% CI: 95% confidence interval (frequentist GLMM)/95% credible interval (Bayesian analyses).
Figure 5
Figure 5
Multivariate risk factor analysis for SARS¬CoV-2 seropositivity. Multivariate risk factor analysis for SARS-CoV-2 seropositivity mutually adjusted for all variables in the figure. OR: odds ratio; 95% CI: 95% credible interval (Bayesian analyses)/95% confidence interval (frequentist GLMM).
Figure 6
Figure 6
Proximity clustering of Ro-N-Ig test outcomes. We subdivide the participants into disjoint clusters according to various cluster definitions: households, buildings, and spatial clusters of various diameters (x-axis). For each cluster, we calculated the within-cluster variance of observed Ro-N-Ig test outcomes of all participants in the cluster. Their means over all clusters are marked by green horizontal lines for each cluster size. We then performed 10,000 random permutations of measurements assignments. The black dots show the respective mean within-cluster variances, along with density estimates as grey curves. For buildings and spatial clusters, measurements of a household were only permuted with measurements of a household of the same size. p-values indicate the one-sided probability of a random value being smaller than or equal to the observed one.

Similar articles

Cited by

References

    1. Rothe C., Schunk M., Sothmann P., Bretzel G., Froeschl G., Wallrauch C., Zimmer T., Thiel V., Janke C., Guggemos W., et al. Transmission of 2019-nCoV Infection from an Asymptomatic Contact in Germany. N. Engl. J. Med. 2020;382:970–971. doi: 10.1056/NEJMc2001468. - DOI - PMC - PubMed
    1. Coronavirus in München: Die Aktuelle Entwicklung [Internet] [(accessed on 9 October 2020)];2020 Available online: https://www.muenchen.de/aktuell/2020-03/coronavirus-muenchen-infektion-a....
    1. Bundesministerium für Gesundheit: Coronavirus SARS-CoV-2: Chronik der Bisherigen Maßnahmen [Internet] [(accessed on 17 March 2021)];2021 Available online: https://www.bundesgesundheitsministerium.de/coronavirus/chronik-coronavi....
    1. Pearce N., Vandenbroucke J.P., VanderWeele T.J., Greenland S. Accurate Statistics on COVID-19 Are Essential for Policy Guidance and Decisions. Am. J. Public Health. 2020;110:949–951. doi: 10.2105/AJPH.2020.305708. - DOI - PMC - PubMed
    1. Meyerowitz-Katz G., Merone L. A systematic review and meta-analysis of published research data on COVID-19 infection fatality rates. Int. J. Infect. Dis. 2020;101:138–148. doi: 10.1016/j.ijid.2020.09.1464. - DOI - PMC - PubMed

Publication types

LinkOut - more resources