

Metabolic Analysis Reveals Cry1C Gene Transformation Does Not Affect the Sensitivity of Rice to Rice Dwarf Virus
- PMID: 33808359
- PMCID: PMC8065979
- DOI: 10.3390/metabo11040209
Metabolic Analysis Reveals Cry1C Gene Transformation Does Not Affect the Sensitivity of Rice to Rice Dwarf Virus
Abstract
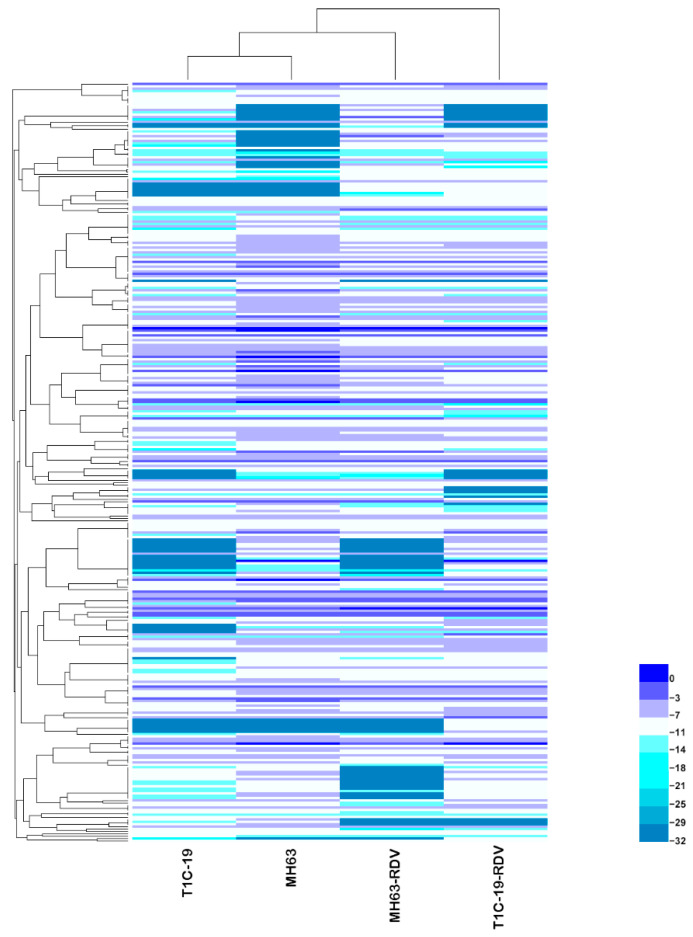
Metabolomics is beginning to be used for assessing unintended changes in genetically modified (GM) crops. To investigate whether Cry1C gene transformation would induce metabolic changes in rice plants, and whether the metabolic changes would pose potential risks when Cry1C rice plants are exposed to rice dwarf virus (RDV), the metabolic profiles of Cry1C rice T1C-19 and its non-Bt parental rice MH63 under RDV-free and RDV-infected status were analyzed using gas chromatography-mass spectrometry (GC-MS). Compared to MH63 rice, slice difference was detected in T1C-19 under RDV-free conditions (less than 3%), while much more metabolites showed significant response to RDV infection in T1C-19 (15.6%) and in MH63 (5.0%). Pathway analysis showed biosynthesis of lysine, valine, leucine, and isoleucine may be affected by RDV infection in T1C-19. No significant difference in the contents of free amino acids (AAs) was found between T1C-19 and MH63 rice, and the free AA contents of the two rice plants showed similar responses to RDV infection. Furthermore, no significant differences of the RDV infection rates between T1C-19 and MH63 were detected. Our results showed the Cry1C gene transformation did not affect the sensitivity of rice to RDV, indicating Cry1C rice would not aggravate the epidemic and dispersal of RDV.
Keywords: Cry1C rice; RDV infection rates; free amino acids; metabolites; rice dwarf virus.
Conflict of interest statement
The authors declare no conflict of interest. The funders had no role in the design of the study; in the collection, analyses, or interpretation of data; in the writing of the manuscript, or in the decision to publish the results.
Figures


References
Grants and funding
- 2016ZX08011-001/National Special Transgenic Project from Chinese Ministry of Agriculture
- LQ18C140001/Science Foundation of Zhejiang Province for Youths
- 2014CB138404/National Program on Key Basic Research Projects (973 Program)
- 2016RA4008/Program for Chinese Innovation Team in Key Areas of Science and Technology of Ministry of Science and Technology of the People's Republic of China
- No/Program for Chinese Outstanding Talents in Agricultural Scientific Research of Ministry of Agriculture and Rural Affairs of the People's Republic of China
LinkOut - more resources
Full Text Sources
Other Literature Sources
Miscellaneous
