. 2021 Mar 30;13(4):470.
doi: 10.3390/pharmaceutics13040470.

Sirolimus Pharmacokinetics Variability Points to the Relevance of Therapeutic Drug Monitoring in Pediatric Oncology

Affiliations

Sirolimus Pharmacokinetics Variability Points to the Relevance of Therapeutic Drug Monitoring in Pediatric Oncology

Amelia-Naomi Sabo et al. Pharmaceutics. .

Abstract

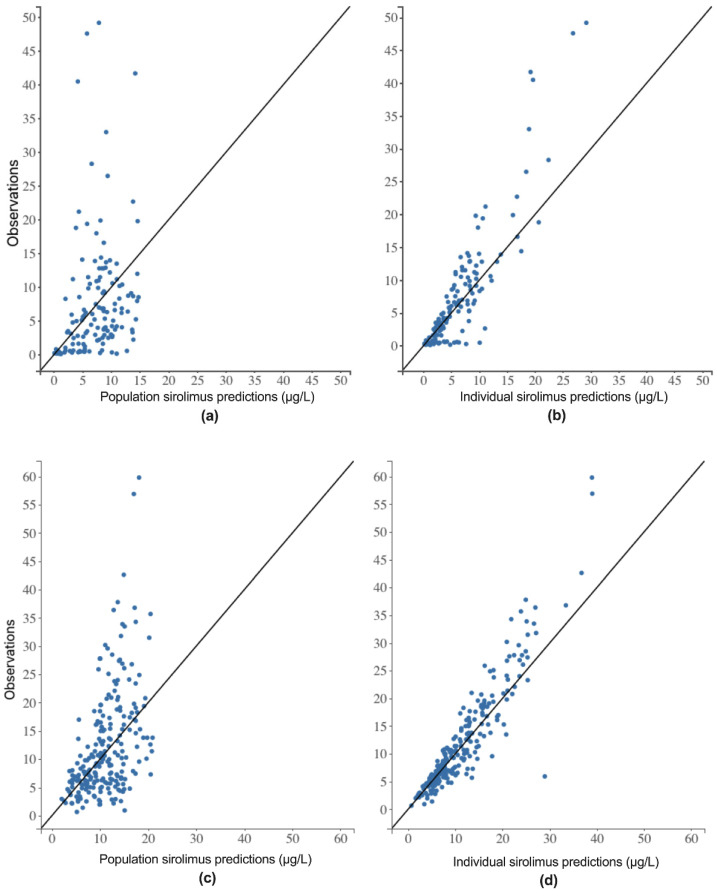
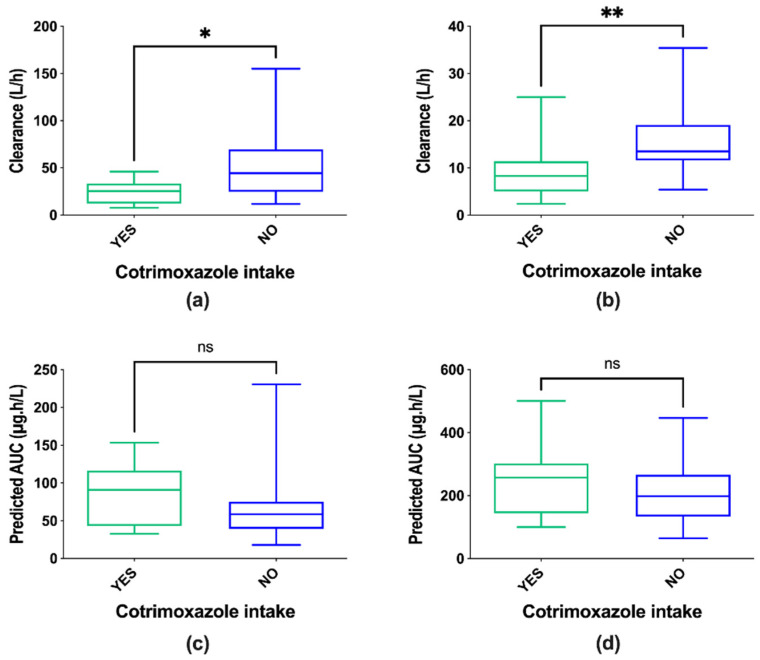
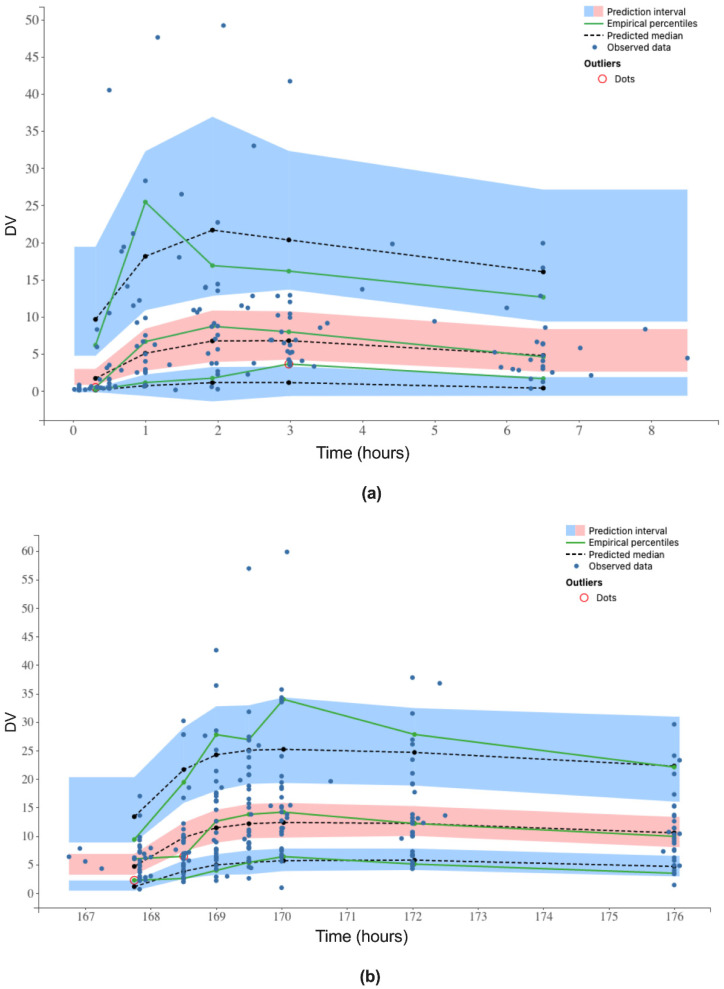
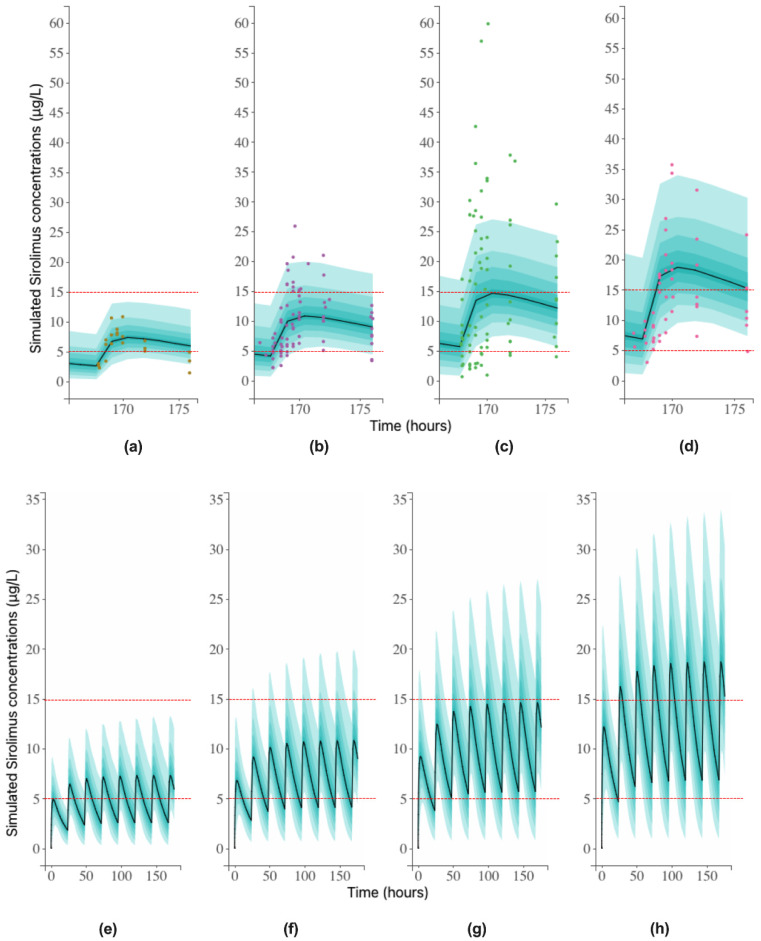
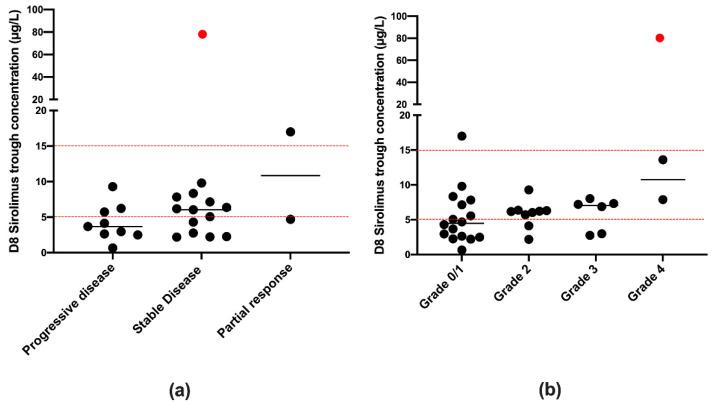
Sirolimus is widely used in transplantation, where its therapeutic drug monitoring (TDM) is well established. Evidence of a crucial role for sirolimus in the PI3K/AkT/mTor pathway has stimulated interest in its involvement in neoplasia, either as monotherapy or in combination with other antineoplastic agents. However, in cancer, there is no consensus on sirolimus TDM. In the RAPIRI phase I trial, the combination sirolimus + irinotecan was evaluated as a new treatment for refractory pediatric cancers. Blood sampling at first sirolimus intake (D1) and at steady state (D8), followed by LC/MS2 analysis, was used to develop a population pharmacokinetic model (Monolix® software). A mono-compartmental model with first-order absorption and elimination best fit the data. The only covariate retained for the final model was "body surface area" (D1 and D8). The model also demonstrated that 1.5 mg/m2 would be the recommended sirolimus dose for further studies and that steady-state TDM is necessary to adjust the dosing regimen in atypical profiles (36.4% of the population). No correlation was found between sirolimus trough concentrations and efficacy and/or observed toxicities. The study reveals the relevance of sirolimus TDM in pediatric oncology as it is needed in organ transplantation.

Keywords: Monolix® software; pediatric oncology; pharmacokinetic population modeling; pharmacokinetics; sirolimus; therapeutic drug monitoring.


Conflict of interest statement

The authors declare no conflict of interest.

Figures

Figure 1
Figure 1
Goodness of fit plots. Observed concentrations versus population predicted concentrations on day 1 (D1) (a) and day 8 (D8) (c). Observed concentrations versus individual predicted concentrations on D1 (b) and D8 (d). Black line: y = x.
Figure 2
Figure 2
Clearance distribution on D1 (a) and D8 (b) with or without cotrimoxazole comedication. Exposures to sirolimus (predicted AUCs) were not statistically different on either D1 (c) or D8 (d) because of a trend of lower doses of sirolimus in patients who were on cotrimoxazole than in patients without cotrimoxazole prophylaxis. Statistical analysis: Unpaired t test, alpha = 0.05. * p < 0.05, ** p < 0.01, ns = no significant differences.
Figure 3
Figure 3
Visual predictive check plots of sirolimus observed concentrations (dependent variable DV in µg/L) versus time after the first sirolimus dose (a) and on D8 (b). Blue areas are 95% confidence interval of the 10th and 90th percentiles. The pink area is the confidence interval of the median. Black dotted lines represent means of the 10th, 50th, and 90th predicted percentiles. Blue dots represent observations and green continuous lines represent means of the 10th, 50th, and 90th observed percentiles. Red circles show deviations of the predicted data from the observations.
Figure 4
Figure 4
Simulated concentrations versus time after 1.0 mg/m2 (a), 1.5 mg/m2 (b), 2.0 mg/m2 (c), and 2.5 mg/m2 (d) of sirolimus on D8. Dots represent observed concentrations on D8. Simulated concentrations versus time after 1.0 mg/m2 (e), 1.5 mg/m2 (f), 2.0 mg/m2 (g), and 2.5 mg/m2 (h) of sirolimus for 8 days. Dashed lines represent the sirolimus therapeutic range (5–15 µg/L). Solid line represents the median, and the nine green bands represent each 10% percentile of the 90% simulated concentrations distribution.
Figure 5
Figure 5
Efficacy and toxicities assessment. Representation of sirolimus trough concentrations at steady state (D8) depending on the disease evolution (a) and the toxicity (b). The red point is an outlier and corresponds to a very high trough concentration (79.6 µg/L) of a patient presenting stable disease evolution and high toxicity. Red dash lines represent sirolimus therapeutic range used in transplantation (5–15 µg/L).

Similar articles

Cited by

References

    1. Diekmann F., Campistol J.M. Conversion from Calcineurin Inhibitors to Sirolimus in Chronic Allograft Nephropathy: Benefits and Risks. Nephrol. Dial. Transplant. 2006;21:562–568. doi: 10.1093/ndt/gfi336. - DOI - PubMed
    1. Vergès B., Cariou B. MTOR Inhibitors and Diabetes. Diabetes Res. Clin. Pract. 2015;110:101–108. doi: 10.1016/j.diabres.2015.09.014. - DOI - PubMed
    1. Hu M., Ekshyyan O., Ferdinandez L.H., Rong X., Caldito G., Nathan C.-A.O. Efficacy and Comparative Effectiveness of Sirolimus as an Anticancer Drug. Laryngoscope. 2011;121:978–982. doi: 10.1002/lary.21724. - DOI - PMC - PubMed
    1. Vincenzi B., Napolitano A., D’Onofrio L., Frezza A.M., Silletta M., Venditti O., Santini D., Tonini G. Targeted Therapy in Sarcomas: Mammalian Target of Rapamycin Inhibitors from Bench to Bedside. Expert Opin. Investig. Drugs. 2011;20:1685–1705. doi: 10.1517/13543784.2011.628984. - DOI - PubMed
    1. Mondesire W.H., Jian W., Zhang H., Ensor J., Hung M.-C., Mills G.B., Meric-Bernstam F. Targeting Mammalian Target of Rapamycin Synergistically Enhances Chemotherapy-Induced Cytotoxicity in Breast Cancer Cells. Clin. Cancer Res. 2004;10:7031–7042. doi: 10.1158/1078-0432.CCR-04-0361. - DOI - PubMed

LinkOut - more resources