. 2021 Mar 30;11(4):210.
doi: 10.3390/metabo11040210.

LDH and PDH Activities in the Ischemic Brain and the Effect of Reperfusion-An Ex Vivo MR Study in Rat Brain Slices Using Hyperpolarized [1-13C]Pyruvate

Affiliations

LDH and PDH Activities in the Ischemic Brain and the Effect of Reperfusion-An Ex Vivo MR Study in Rat Brain Slices Using Hyperpolarized [1-13C]Pyruvate

Gal Sapir et al. Metabolites. .

Abstract

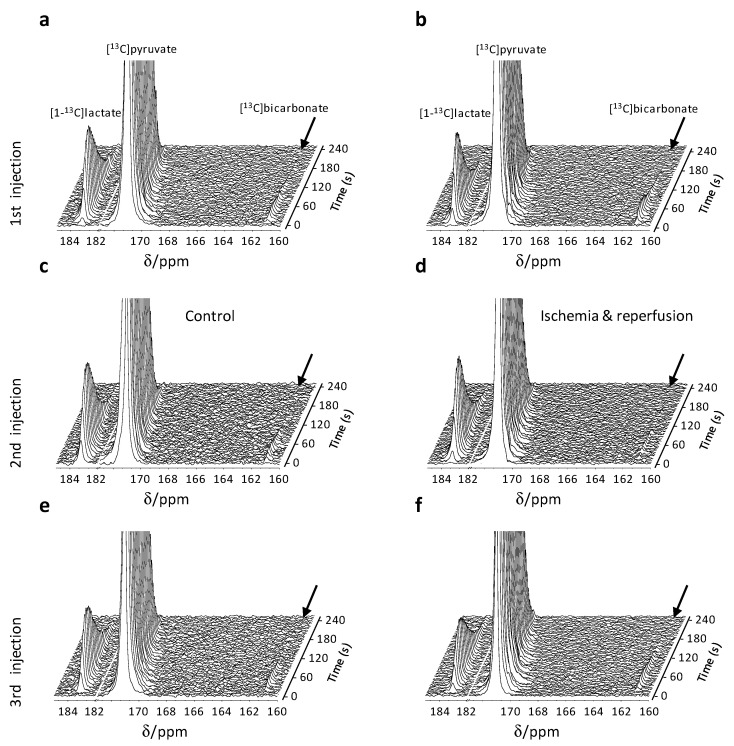
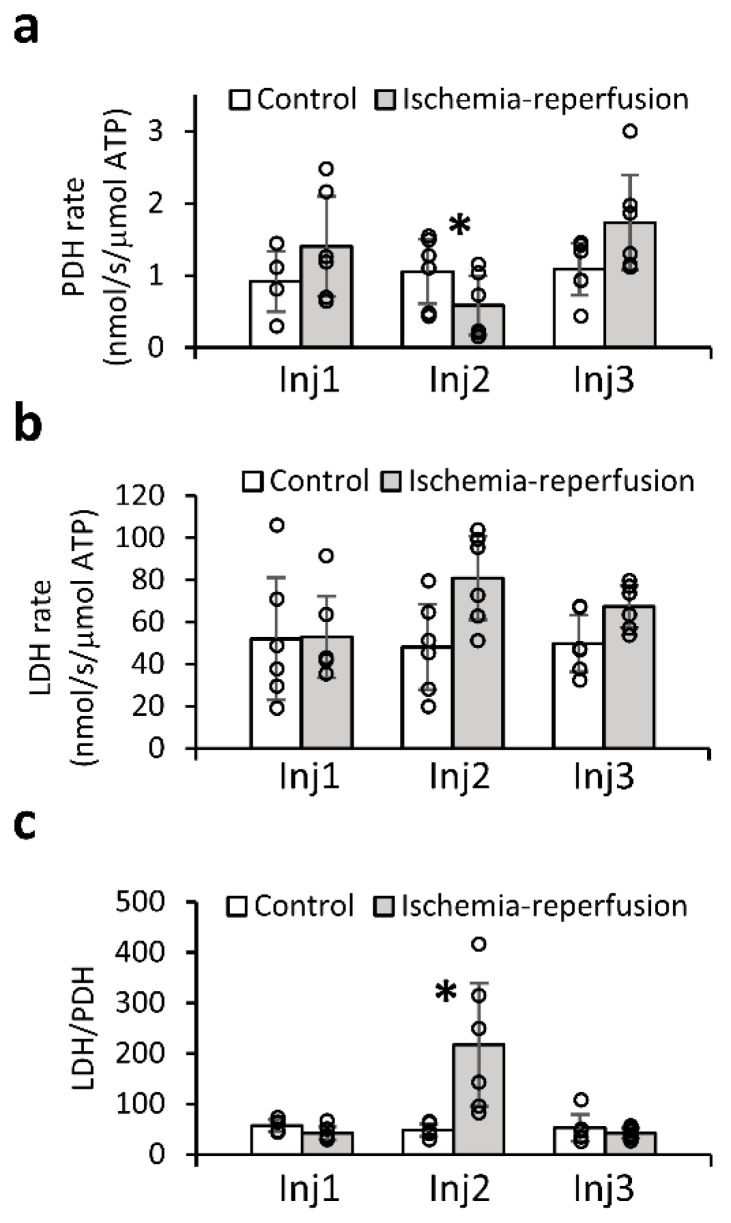
Ischemic stroke is a leading cause for neurologic disability worldwide, for which reperfusion is the only available treatment. Neuroimaging in stroke guides treatment, and therefore determines the clinical outcome. However, there are currently no imaging biomarkers for the status of the ischemic brain tissue. Such biomarkers could potentially be useful for guiding treatment in patients presenting with ischemic stroke. Hyperpolarized 13C MR of [1-13C]pyruvate is a clinically translatable method used to characterize tissue metabolism non-invasively in a relevant timescale. The aim of this study was to utilize hyperpolarized [1-13C]pyruvate to investigate the metabolic consequences of an ischemic insult immediately during reperfusion and upon recovery of the brain tissue. The rates of lactate dehydrogenase (LDH) and pyruvate dehydrogenase (PDH) were quantified by monitoring the rates of [1-13C]lactate and [13C]bicarbonate production from hyperpolarized [1-13C]pyruvate. 31P NMR of the perfused brain slices showed that this system is suitable for studying ischemia and recovery following reperfusion. This was indicated by the levels of the high-energy phosphates (tissue viability) and the chemical shift of the inorganic phosphate signal (tissue pH). Acidification, which was observed during the ischemic insult, has returned to baseline level following reperfusion. The LDH/PDH activity ratio increased following ischemia, from 47.0 ± 12.7 in the control group (n = 6) to 217.4 ± 121.3 in the ischemia-reperfusion group (n = 6). Following the recovery period (ca. 1.5 h), this value had returned to its pre-ischemia (baseline) level, suggesting the LDH/PDH enzyme activity ratio may be used as a potential indicator for the status of the ischemic and recovering brain.

Keywords: brain slices; dissolution dynamic nuclear polarization; ischemic stroke; lactate dehydrogenase; pyruvate dehydrogenase; reperfusion.


Conflict of interest statement

The authors declare no conflict of interest.

Figures

Figure 1
Figure 1
Experimental timeline and slice viability throughout the experiments. (a) Experimental workflow. Following surgery and slice recovery (solid grey timeline), the brain slices were placed in the NMR tube and were continuously perfused therein (solid blue timeline). The control group was maintained in this state for the entire duration of the experiment. The 1st injection of hyperpolarized medium was administered about 1 h following the start of perfusion in the NMR spectrometer. About 1.5 h after the 1st injection, the 2nd injection of hyperpolarized medium was administered. For the ischemia-reperfusion group, perfusion was stopped for ca. 11 min (brown rectangle) prior to the 2nd injection. A third injection was performed about 1.5 h after the 2nd injection. Injections are marked by grey arrows and the injection times are marked per injection. Injections coincide with 13C acquisitions, and 31P acquisitions are performed before and after the injections. (b) Typical 31P NMR spectra acquired from brain slices during continuous perfusion in the spectrometer during a control experiment. (c) Typical 31P NMR spectra acquired from brain slices in the perfusion system during an experiment with an ischemic insult. The ischemic insult (brown arrow) was applied once the acquisition of the middle 31P spectrum was completed. The second injection was administered at the end of the ischemic insult (and provided reperfusion). Times are indicated in h (the time of the first injection of [1-13C]pyruvate was referred to as t = 0). The acquisition of the 31P spectra was completed before each injection (for the second injection, the acquisition was completed before the ischemic insult). Each spectrum was acquired over 1 h, using 3296 excitations (1.1 s repetition time, 50° nutation angle, in batches of 412 scans). The spectra were processed with a line-broadening of 7 Hz and zero-filled from 8,192 to 16,384 points. The spectra were referenced to the PCr signal at −2.5 ppm. The baseline was manually corrected. The signal of Pi was truncated for better visualization of the high-energy phosphates’ signals. The increase in the relative intensity of the Pi signal in the second and third spectra is due to a high phosphate content in the injected hyperpolarized medium which was not fully washed out following the injections. ATP—adenosine triphosphate, ADP—adenosine diphosphate, PCr—phosphocreatine, Pi—inorganic phosphate (intra- and extracellular), PME—phosphomonoesters, NAD—nicotinamide adenine dinucleotide.
Figure 2
Figure 2
31P spectra demonstrating rapid changes in the Pi signal chemical shift and lineshape due to ischemia. The spectral region showing the Pi signal before (bottom), during (middle), and immediately following (top) the ischemic insult in a typical experiment. The Pi signal widens upon ischemia and narrows following reperfusion indicating alterations in pH. The spectra were collected over 7.6 min (412 excitations, 1.1 s repetition time, 50° nutation angle) and processed with a line-broadening of 7 Hz and zero-filling from 8192 to 16,384 points. The chemical shift was referenced to the PCr signal at −2.5 ppm. The baseline was manually corrected. Pi—inorganic phosphate (intra- and extracellular).
Figure 3
Figure 3
13C spectra of hyperpolarized [1-13C]pyruvate metabolism in rat brain slices. (af) Stacked 13C NMR spectra following injection of hyperpolarized [1-13C]pyruvate. (a,b) Spectra acquired following the first injection in a control experiment and an ischemia and reperfusion experiment, respectively. (c,d) Spectra acquired following the second injection in a control experiment and an ischemia-reperfusion experiment, respectively. Note the reduced intensity of the [13C]bicarbonate signal in d. (e,f) Spectra acquired following the third injection in a control experiment and an ischemia and reperfusion experiment, respectively. Note the recovery of the [13C]bicarbonate signal ca. 1.5 h after the ischemia in f. Acquisition parameters: 2.5 ms cardinal-sine frequency-selective pulse, 16,384 time-domain points, 12.5 kHz spectral width. The spectra were acquired in an interleaved manner, with a repetition time (TR) of 4 s between excitations, yielding an 8 s repetition time for each metabolite. The spectra were processed with 5% drift correction, 7 Hz line-broadening, zero-filling from 16,384 to 32,768 points, manual phase and baseline correction, and referenced to the [1-13C]pyruvate signal at 171.0 ppm.
Figure 4
Figure 4
Signal time courses and selection of time points for enzymatic rate determination. (a) A typical time course of the hyperpolarized signal intensities following injection of hyperpolarizedpyruvate to brain slices. The measured [1-13C]pyruvate signal is shown with “x” markers and the T1_eff corrected signal is marked with open circles. The T1_eff corrected signal was used to determine the time frame at which the concentration of [1-13C]pyruvate in the sensitive region of the NMR probe was constant and maximal (shaded area). Only measurements within this time frame were used for the enzymatic rate determination (Methods). For [13C]bicarbonate, the averaged spectrum of three consecutive spectra was used for each point. (b) The PDH rate determined from the data presented in a. Only points in the shaded area were used for rate calculation. (c) The LDH rate determined from the data presented in a. Only points in the shaded area were used for rate calculation.
Figure 5
Figure 5
Production rates of [1-13C]lactate and [13C]bicarbonate. (a,b) Enzymatic activity relative to the ATP content of the slices (in nmol/s/μmol ATP), for PDH and LDH, respectively. In a, 16 injections were taken in total (n = 4 for Inj1, n = 6 for each of Inj2 and Inj3). For b, 18 injections are taken in total (n = 6 for each of three injections). (c) LDH to PDH activities ratio. The enzymatic activities were determined by the production rate of hyperpolarized [1-13C]lactate and [13C]bicarbonate, respectively, (n = 16 injections in total, n = 4 for Inj1 and n = 6 for each of Inj2 and Inj3). For each group, the ratio was determined per injection (dividing the averaged LDH activity of that injection to the PDH activity determined in the same injection), then averaged per injection number per group. PDH—pyruvate dehydrogenase, LDH—lactate dehydrogenase. Bars and error bars represent the mean and standard deviation, respectively. Circles mark values from individual injections. *—Significant difference.

Similar articles

Cited by

References

    1. Feigin V.L., Nichols E., Alam T., Bannick M.S., Beghi E., Blake N., Culpepper W.J., Dorsey E.R., Elbaz A., Ellenbogen R.G., et al. Global, regional, and national burden of neurological disorders, 1990-2016: A systematic analysis for the global burden of disease study. Lancet Neurol. 2019;18:459–480. doi: 10.1016/S1474-4422(18)30499-X. - DOI - PMC - PubMed
    1. Feigin V.L., Forouzanfar M.H., Krishnamurthi R., Mensah G.A., Connor M., Bennett D.A., Moran A.E., Sacco R.L., Anderson L., Truelsen T., et al. Global and regional burden of stroke during 1990-2010: Findings from the global burden of disease study. Lancet. 2014;383:245–254. doi: 10.1016/S0140-6736(13)61953-4. - DOI - PMC - PubMed
    1. Virani S.S., Alonso A., Benjamin E.J., Bittencourt M.S., Callaway C.W., Carson A.P., Chamberlain A.M., Chang A.R., Cheng S., Delling F.N., et al. Heart disease and stroke statistics-2020 update: A report from the american heart association. Circulation. 2020;141:e139–e596. doi: 10.1161/CIR.0000000000000757. - DOI - PubMed
    1. Zerna C., Thomalla G., Campbell B.C.V., Rha J.H., Hill M.D. Current practice and future directions in the diagnosis and acute treatment of ischaemic stroke. Lancet. 2018;392:1247–1256. doi: 10.1016/S0140-6736(18)31874-9. - DOI - PubMed
    1. Powers W.J., Rabinstein A.A., Ackerson T., Adeoye O.M., Bambakidis N.C., Becker K., Biller J., Brown M., Demaerschalk B.M., Hoh B., et al. 2018 guidelines for the early management of patients with acute ischemic stroke: A guideline for healthcare professionals from the american heart association/american stroke association. Stroke. 2018;49:e46–e110. doi: 10.1161/STR.0000000000000158. - DOI - PubMed

LinkOut - more resources