. 2021 Mar 30;22(7):3604.
doi: 10.3390/ijms22073604.

Vitamin D Deficiency Induces Chronic Pain and Microglial Phenotypic Changes in Mice

Affiliations

Vitamin D Deficiency Induces Chronic Pain and Microglial Phenotypic Changes in Mice

Nicola Alessio et al. Int J Mol Sci. .

Abstract

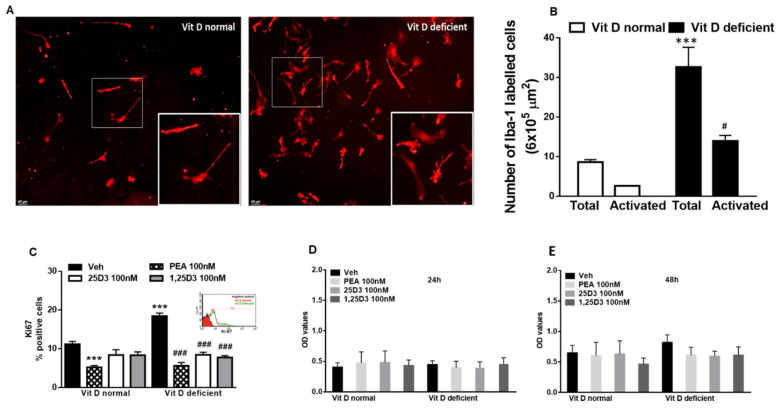
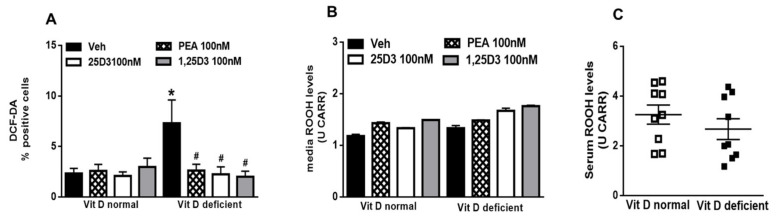
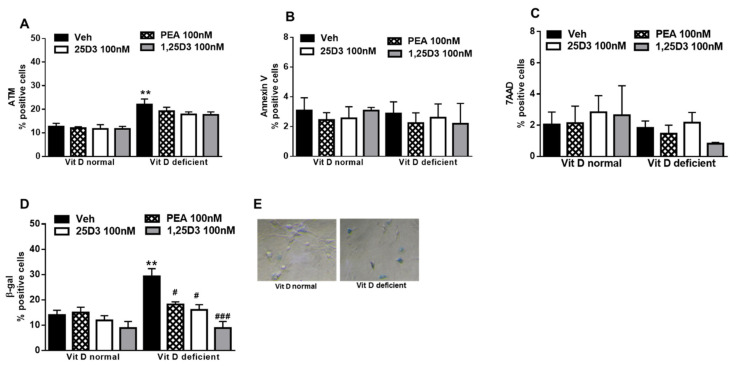
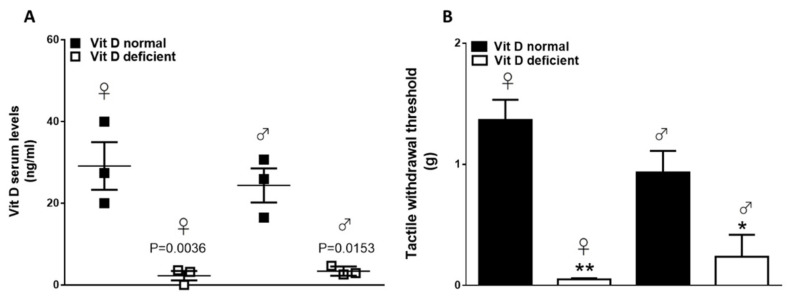
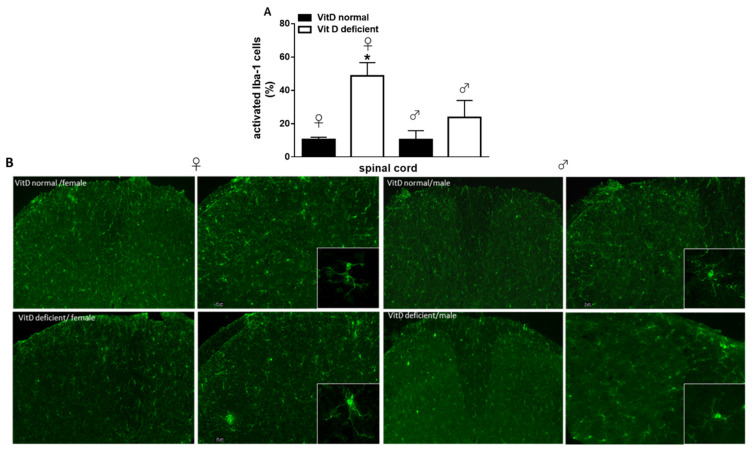
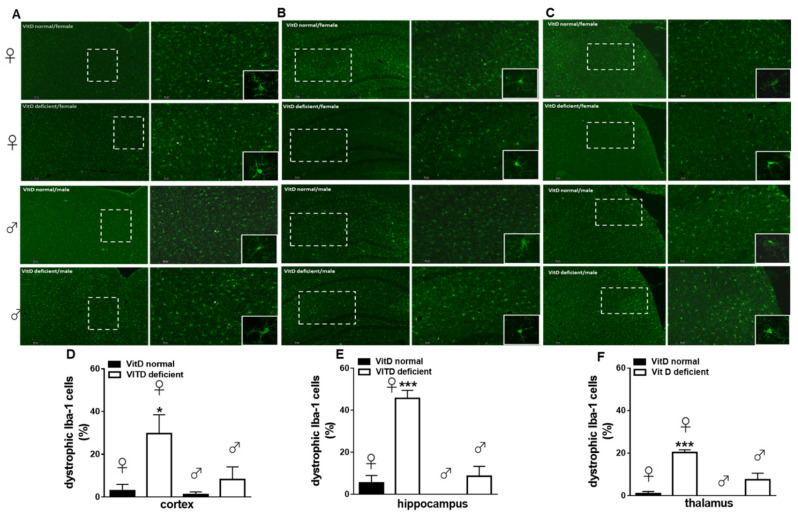
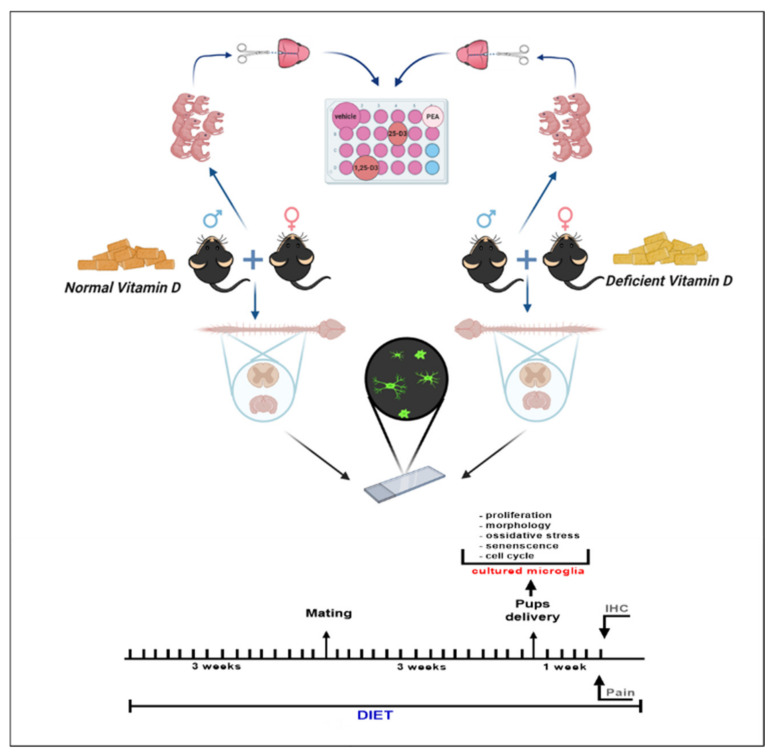
The bioactive form of vitamin D, 1,25-dihydroxyvitamin D (1,25D3), exerts immunomodulatory actions resulting in neuroprotective effects potentially useful against neurodegenerative and autoimmune diseases. In fact, vitamin D deficiency status has been correlated with painful manifestations associated with different pathological conditions. In this study, we have investigated the effects of vitamin D deficiency on microglia cells, as they represent the main immune cells responsible for early defense at central nervous system (CNS), including chronic pain states. For this purpose, we have employed a model of low vitamin D intake during gestation to evaluate possible changes in primary microglia cells obtained from postnatal day(P)2-3 pups. Afterwards, pain measurement and microglia morphological analysis in the spinal cord level and in brain regions involved in the integration of pain perception were performed in the parents subjected to vitamin D restriction. In cultured microglia, we detected a reactive-activated and proliferative-phenotype associated with intracellular reactive oxygen species (ROS) generation. Oxidative stress was closely correlated with the extent of DNA damage and increased β-galactosidase (B-gal) activity. Interestingly, the incubation with 25D3 or 1,25D3 or palmitoylethanolamide, an endogenous ligand of peroxisome proliferator-activated-receptor-alpha (PPAR-α), reduced most of these effects. Morphological analysis of ex-vivo microglia obtained from vitamin-D-deficient adult mice revealed an increased number of activated microglia in the spinal cord, while in the brain microglia appeared in a dystrophic phenotype. Remarkably, activated (spinal) or dystrophic (brain) microglia were detected in a prominent manner in females. Our data indicate that vitamin D deficiency produces profound modifications in microglia, suggesting a possible role of these cells in the sensorial dysfunctions associated with hypovitaminosis D.

Keywords: chronic pain; gender; microglia; palmitoylethanolamide; vitamin D deficiency.


Conflict of interest statement

The authors declare no conflict of interest.

Figures

Figure 1
Figure 1
(A) Representative staining and related quantification (B) of primary microglia cells in Iba-1 labeled microglia cells in normal or deficient Vitamin D (Vit D) conditions. Morphological evaluations measured as the number of total or activated cells. Data are shown as mean ± SEM (cells samples n = 6–8). *** indicates statistically significant values (p < 0.0001) vs. total number of VitD-normal cells; # indicates statistically significant values (p < 0.05) vs. activated VitD-normal cells. Two-way ANOVA, post-hoc Tukey’s. (C) Analysis of Ki67-positive microglia in normal or deficient VitD conditions in the presence of vehicle (DMSO 0.001%, 24 h) or 25D3 or 1,25D3 or PEA (100 nM, 24 h). *** indicates statistically significant values (p < 0.0001) vs. vehicle-treated VitD-normal cells; ### indicates statistically significant values (p < 0.0001) vs. vehicle-treated Vitamin D-deficient cells (cells samples n = 6–8). (D,E) Measurement of microglial cell viability (24 h and 48 h) in normal or deficient VitD conditions in the presence of 25D3 or 1,25D3 or PEA (100 nM, 24 h). Data are expressed as Optical density (OD) values (cells samples n = 12). Two-way ANOVA, post-hoc Tukey’s.
Figure 2
Figure 2
(A) Intracellular ROS generation from 2,7-dichlorodihydrofluorescein diacetate (DCFH-DA) assay in normal or deficient Vitamin D (VitD) primary microglia cells. (B) Reactive oxygen species (ROS) levels (ROOH production) detected in the cell media of normal or deficient VitD microglia cells. Data were expressed as means ± SEM (U CARR). (C) ROS levels (ROOH production) detected in the serum of normal or deficient VitD pups. Data were expressed as means ± SEM (U CARR). Cells were treated were vehicle (DMSO 0.001%, 24 h) or 25D3 or 1,25D3 or PEA (100 nM, 24 h) (cells samples n = 6–8). * indicates statistically significant (p < 0.05) difference vs. vehicle-treated VitD-normal cells; # indicates statistically significant difference vs. vehicle-treated VitD-deficient cells. Two-way ANOVA, post-hoc Tukey’s.
Figure 3
Figure 3
(A) Percentage of ataxia-telangiectasia mutated (ATM)-positive normal or deficient VitD primary microglia cells. (B) Percentage of Annexin V-positive normal or deficient VitD microglia cells. (C) Percentage of 7AAD normal or deficient VitD microglia cells. (D,E) Percentage of β-Gal in normal or deficient VitD primary microglia cells. Cells were treated with vehicle (DMSO 0.001%, 24 h) or 25D3 or 1,25D3 or PEA (100 nM, 24 h). Values are represented as mean ± SEM (cells samples n = 6–8), ** indicates statistically (p ≤ 0.001) significant difference vs. vehicle-treated VitD-normal cells; # and ### indicate statistically (p ≤ 0.05 and p ≤ 0.0001) significant difference vs. vehicle-treated VitD-deficient cells. Two-way ANOVA, post-hoc Tukey’s.
Figure 4
Figure 4
(A) Vitamin D serum levels in normal (VitD normal) and vitamin-D-deficient (VitD normal) female or male mice. Data are expressed as mean ± SEM (n = 3 for each group). (B) Tactile withdrawal threshold in normal (VitD normal) and vitamin D-deficient (VitD deficient) female or male mice. Data are expressed as mean ± SEM; * and ** indicate statistically significant (p ≤ 0.05 and p ≤ 0.001) difference vs. VitD normal mice (n = 3 for each group).
Figure 5
Figure 5
(A) Quantitative analysis and (B) representative images and of the activated Iba-1 positive cells in the spinal cord of VitD-normal or VitD-deficient female or male mice. Squares represent crop of a single Iba-1 positive profile to highlight the morphology. Data are expressed as the percentage of activated microglia cells vs. the total cells number for each group (n = 3 mice per group). * indicates statistically (p ≤ 0.05) significant difference vs. related control. Two-way ANOVA, post hoc Tukey. Scale bars 5 and 20 µm.
Figure 6
Figure 6
Representative images and quantitative analysis of the dystrophic Iba-1 positive cells in the cortex (A,D), hippocampus (B,E), and thalamus (C,F) of VitD-normal or VitD-deficient female or male mice. Squares represent crop of a single Iba-1 positive profile to highlight the morphology. Data are expressed as the percentage of dystrophic microglia cells vs. the total cells number for each group (n = 3 mice per group). * and *** indicate statistically (p ≤ 0.05 and p ≤ 0.001) significant difference vs. related control. Two-way ANOVA post hoc Tukey. Scale bars 5 and 20 µm.
Scheme 1
Scheme 1
Scheme showing experimental design of the study. The image was created with BioRender drawing software.

References

    1. Eyles D.W., Smith S., Kinobe R., Hewison M., McGrath J.J. Distribution of the Vitamin D receptor and 1α-hydroxylase in human brain. J. Chem. Neuroanat. 2005;29:21–30. doi: 10.1016/j.jchemneu.2004.08.006. - DOI - PubMed
    1. Langub M., Herman J., Malluche H., Koszewski N. Evidence of functional vitamin D receptors in rat hippocampus. Neuroscience. 2001;104:49–56. doi: 10.1016/S0306-4522(01)00049-5. - DOI - PubMed
    1. Malcangio M. Translational value of preclinical models for rheumatoid arthritis pain. Pain. 2020;161:1399–1400. doi: 10.1097/j.pain.0000000000001851. - DOI - PubMed
    1. Boontanrart M., Hall S.D., Spanier J.A., Hayes C.E., Olson J.K. Vitamin D3 alters microglia immune activation by an IL-10 dependent SOCS3 mechanism. J. Neuroimmunol. 2016;292:126–136. doi: 10.1016/j.jneuroim.2016.01.015. - DOI - PubMed
    1. Landel V., Stephan D., Cui X., Eyles D., Feron F. Differential expression of vitamin D-associated enzymes and receptors in brain cell subtypes. J. Steroid Biochem. Mol. Biol. 2018;177:129–134. doi: 10.1016/j.jsbmb.2017.09.008. - DOI - PubMed

MeSH terms

LinkOut - more resources