

Revalorization of Coffee Husk: Modeling and Optimizing the Green Sustainable Extraction of Phenolic Compounds
- PMID: 33808664
- PMCID: PMC8003551
- DOI: 10.3390/foods10030653
Revalorization of Coffee Husk: Modeling and Optimizing the Green Sustainable Extraction of Phenolic Compounds
Abstract
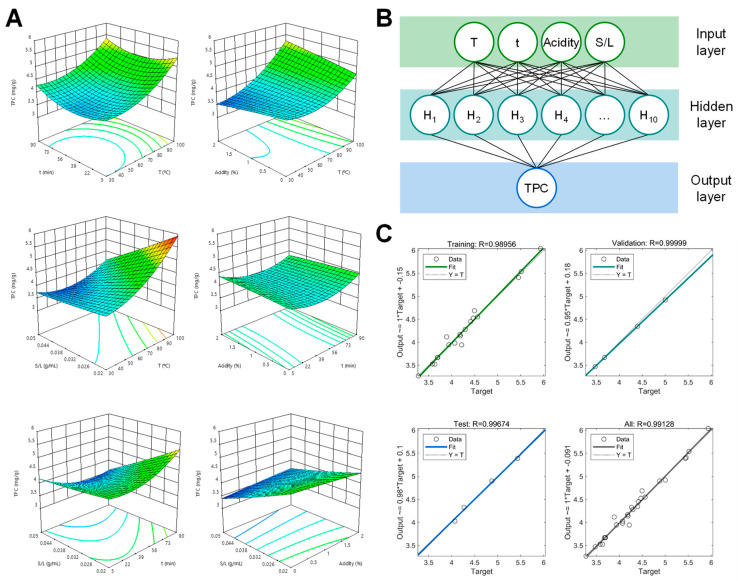
This study aimed to model and optimize a green sustainable extraction method of phenolic compounds from the coffee husk. Response surface methodology (RSM) and artificial neural networks (ANNs) were used to model the impact of extraction variables (temperature, time, acidity, and solid-to-liquid ratio) on the recovery of phenolic compounds. All responses were fitted to the RSM and ANN model, which revealed high estimation capabilities. The main factors affecting phenolic extraction were temperature, followed by solid-to-liquid ratio, and acidity. The optimal extraction conditions were 100 °C, 90 min, 0% citric acid, and 0.02 g coffee husk mL-1. Under these conditions, experimental values for total phenolic compounds, flavonoids, flavanols, proanthocyanidins, phenolic acids, o-diphenols, and in vitro antioxidant capacity matched with predicted ones, therefore, validating the model. The presence of chlorogenic, protocatechuic, caffeic, and gallic acids and kaemferol-3-O-galactoside was confirmed by UPLC-ESI-MS/MS. The phenolic aqueous extracts from the coffee husk could be used as sustainable food ingredients and nutraceutical products.
Keywords: antioxidant capacity; artificial neural networks; coffee by-products; phenolic compounds; response surface methodology.
Conflict of interest statement
The authors declare no conflict of interest.
Figures
 ) to the highest (
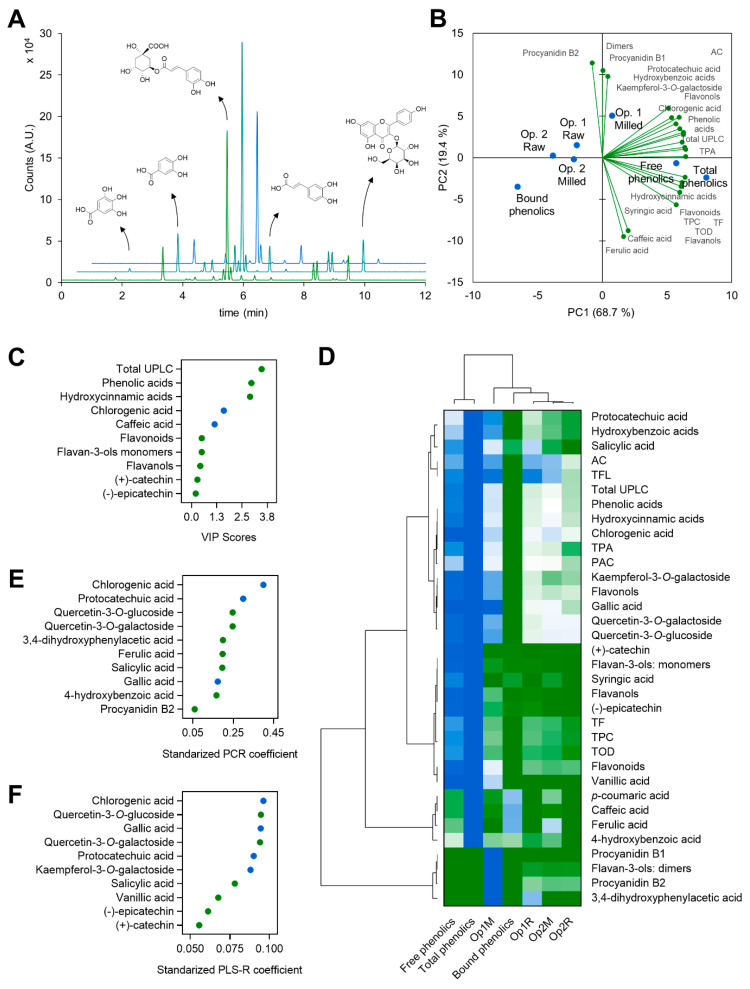
 ) value for each parameter) (D) showing the associations among the measured parameters and classifying phenolic extracts from coffee husk according to them, and the ten most significant coefficients from principal components regression, PCR (E) and principal least squares regression, PLS-R (F). Circles in different colors indicate minor phenolic or phenolic family, green (
 ), major phenolic, blue (
 ).
).
References
-
- United Nations Sustainable Consumption and Production. [(accessed on 17 February 2021)]; Available online: https://www.un.org/sustainabledevelopment/sustainable-consumption-produc...
-
- FAO . Sustainable Food Systems Concept and Framework. What Is a Sustainable Food System? Why Take a Food Systems Approach? Changing Food Systems. FAO; Rome, Italy: 2018. pp. 1–8.
-
- Torres-León C., Ramírez-Guzman N., Londoño-Hernandez L., Martinez-Medina G.A., Díaz-Herrera R., Navarro-Macias V., Alvarez-Pérez O.B., Picazo B., Villarreal-Vázquez M., Ascacio-Valdes J., et al. Food Waste and Byproducts: An Opportunity to Minimize Malnutrition and Hunger in Developing Countries. Front. Sustain. Food Syst. 2018;2:52. doi: 10.3389/fsufs.2018.00052. - DOI
-
- de Sousa e Silva J., Moreli A.P., Donzeles S.M.L., Soares S.F., Vitor D.G. Food Engineering Series. Springer; Berlin/Heidelberg, Germany: 2021. Harvesting, Drying and Storage of Coffee; pp. 1–64. - DOI
Grants and funding
LinkOut - more resources
Full Text Sources
Other Literature Sources
