. 2021 Mar 19;22(6):3143.
doi: 10.3390/ijms22063143.

Melanin Distribution in Human Skin: Influence of Cytoskeletal, Polarity, and Centrosome-Related Machinery of Stratum basale Keratinocytes

Affiliations

Melanin Distribution in Human Skin: Influence of Cytoskeletal, Polarity, and Centrosome-Related Machinery of Stratum basale Keratinocytes

Irene Castellano-Pellicena et al. Int J Mol Sci. .

Abstract

Melanin granules cluster within supra-nuclear caps in basal keratinocytes (KCs) of the human epidermis, where they protect KC genomic DNA against ultraviolet radiation (UVR) damage. While much is known about melanogenesis in melanocytes (MCs) and a moderate amount about melanin transfer from MC to KC, we know little about the fate of melanin once inside KCs. We recently reported that melanin fate in progenitor KCs is regulated by rare asymmetric organelle movement during mitosis. Here, we explore the role of actin, microtubules, and centrosome-associated machinery in distributing melanin within KCs. Short-term cultures of human skin explants were treated with cytochalasin-B and nocodazole to target actin filaments and microtubules, respectively. Treatment effects on melanin distribution were assessed by the Warthin-Starry stain, on centrosome-associated proteins by immunofluorescence microscopy, and on co-localisation with melanin granules by brightfield microscopy. Cytochalasin-B treatment disassembled supra-nuclear melanin caps, while nocodazole treatment moved melanin from the apical to basal KC domain. Centrosome and centriolar satellite-associated proteins showed a high degree of co-localisation with melanin. Thus, once melanin granules are transferred to KCs, their preferred apical distribution appears to be facilitated by coordinated movement of centrosomes and centriolar satellites. This mechanism may control melanin's strategic position within UVR-exposed KCs.

Keywords: Stratum basale keratinocytes; actin; centriolar satellites; centrosome; epidermis; ex vivo human skin; melanin distribution; microtubules; skin phototype.


Conflict of interest statement

M.B. and C.O.’C. are employees of Walgreen-Boots Alliance (UK).

Figures
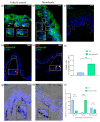
Figure 1
Figure 1
Microtubule depolymerisation (nocodazole treatment) influences the subcellular localisation of melanin aggregation in Stratum basale KC of human ex vivo skin epidermis. (a) Localisation of α-tubulin (green) showing microtubules in VC- and (b) nocodazole-treated ex vivo skin tissue after 24 h in culture; scale bar = 20 µm. (c) Negative control (omission of primary antibody) showed lack of non-specific binding. (d) Proliferating (Ki67 in red) and mitosis-stalled (pH3(Ser10) in green) KCs in VC- and (e) nocodazole-treated human ex vivo skin after 24 h in culture; scale bar = 50 µm as stated in the figure. (f) Percentage (%) of pH3(Ser10)-positive KCs per S. basale KC in VC- and nocodazole-treated cells. ** shows p-value < 0.01 in an unpaired t-test. (g) Warthin–Starry stain shows melanin localisation in vehicle control- (VC) and (h) nocodazole-treated ex vivo skin tissue after 24 h in culture; scale bar = 20 µm. Nuclei were counterstained with 4′,6-diamidino-2-phenylindole (DAPI in blue). Representative images from three individual donors. (i) Quantification of subcellular localisation of melanin. Graph shows the percentage (%) of S. basale cells with apical, perinuclear, and basal located melanin granules. Data are the mean ± SD of three independent biological experiments (n = 3 donors; 58–110 cells/replicate), *** indicates p-value < 0.001 and ns indicates not significant in a two-way ANOVA test.
Figure 2
Figure 2
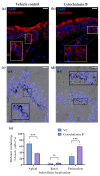
Reduced actin polymerisation after cytochalasin B treatment affects melanin aggregation in the S. basale KCs in human skin ex vivo. (a) Polymerised actin (phalloidin staining) is shown in red in VC- and (b) cytochalasin B-treated skin after 24 h in culture. Nuclear counterstain (DAPI) is shown in blue. (c) Warthin–Starry stain shows melanin localisation in VC- and (d) cytochalasin B-treated ex vivo skin after 24 h in culture. Scale bar = 20 µm. The basement membrane zone is shown by a white dotted line. (e) Quantification of subcellular localisation of melanin. Graph shows the percentage (%) of S. basale cells with apical, perinuclear, and basal located melanin. Data are the mean ± SD of three independent biological experiments (n = 3 donors; 61–131 cells/replicate). *** indicates p-value < 0.001 and ns indicates not significant in a two-way ANOVA test.
Figure 3
Figure 3
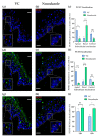
Microtubule depolymerisation (after nocodazole treatment) affects the subcellular localisation of the centrosome (PCNT) and centriolar satellites (PCM1) in S. basale KCs in human skin ex vivo. (a) Localisation of the centrosome (red) in VC- and (b) nocodazole-treated ex vivo skin after 24 h in culture. (c) Quantification of subcellular localisation of centrosome. Graph shows the percentage (%) of S. basale KCs with apical, basal and central PCNT localisation. ** indicates p-value < 0.01, *** indicates p-value < 0.001 and ns indicates not significant in a two-way ANOVA test (n = 3 donors; 33–55 PCNT dots/replicate). (d) Localisation of centriolar satellites (green) in VC- and (e) nocodazole-treated ex vivo skin after 24 h in culture. (f) Quantification of centriolar satellite localisation. Graph shows the percentage (%) of PCM1 satellite clouds with apical, basal and central localisation. *** indicates p-value < 0.001 and ns indicates not significant in a two-way ANOVA test (n = 3 donors, 25–45 PCM1 clouds/replicate). (g) Co-localisation (orange/yellow) of centrosome (PCNT, red) and centriolar satellites (PCM1, green) in VC- and (h) nocodazole-treated ex vivo tissues after 24 h in culture. (i) Quantification of centrosome co-localisation with centriolar satellites. Graph shows the percentage (%) of co-localisation in S. basale KCs. * indicates p-value < 0.05, ns indicates not significant using one-way ANOVA (n = 3 donors, 22–60 cells/replicate).
Figure 4
Figure 4
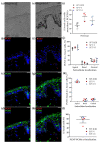
Centrosome (PCNT) and Centriolar satellites (PCM1) in low vs. high SPT skin. Representative images (scale bar = 20 µm) of SPT-II/III human skin tissue; (a) brightfield image showing low level of pigmentation, (b) in situ localisation of centrosomes (PCNT in red) and (c) centriolar satellites (PCM1 in green). (d) Merged image of b and c. Representative images of SPT-VI human skin tissue; (e) brightfield image showing high level of pigmentation, (f) in situ localisation of PCNT in red and (g) PCM1 in green. (h) Merged image of f and g. (i) Quantification of S. basale KCs with more than one centrosome. Graph shows the percentage (%) of S. basale KC with more than one centrosome (i.e., PCNT dot) in SPT-II/III (black), V (red) and VI (blue) human skin. No significant differences were found using one-way ANOVA test (each dot represents the summary data for one donor, n = 12). (j) Quantification of subcellular localisation of centrosomes. Graph shows the percentage (%) of the total centrosomes (PCNT dots) that showed an apical, basal and perinuclear/central localisation in SPTII/III (black), SPTV (red) and SPTVI (blue) human skin. No significant differences were found using multiple t-test (each dot represents the summary data for one donor, n = 12). (k) Quantification of subcellular localisation of centriolar satellites (PCM1). Graph shows the percentage (%) of the total PCM1 clouds with an apical, basal and perinuclear/central localisation in SPTII/III (black), SPTV (red) and SPTVI (blue) human skin (each dot represents the summary data for one donor, n = 7). (l) Number of S. basale KC (%) showing PCNT co-localisation with PCM1 (each dot represents the summary data for one donor, n = 7). Each individual donor is represented using the same colour shade in all graphs of this figure.
Figure 5
Figure 5
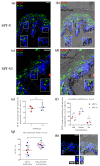
Co-localisation of centrosomes (PCNT) and centriolar satellites (PCM1) with melanin granules in highly pigmented human skin (SPT V and VI). (a) Representative image of PCNT (red) and PCM1 (green) localisation in SPT V skin. (b) Image a merged with brightfield microscopy view. (c) Representative image of PCNT (red) and PCM1 (green) localisation in SPT VI skin. (d) Image (c) merged with brightfield microscopy view. (e) Percentage (%) of pigmented S. basale KC showing co-localisation of PCNT and melanin; ns indicates not significant in an unpaired non-parametric t-test (Mann–Whitney). (f) Percentage (%) of PCM1 clouds (centriolar satellites) showing full, partial or no co-localisation with melanin; ns indicates not significant in a two-way ANOVA. (g) Percentage (%) of centrosomes (PCNT) showing an apical localisation in pigmented S. basale cells in comparison with the percentage (%) of centrosomes co-localising with melanin independently of its subcellular localisation; * indicates p value < 0.05 in a paired non-parametric t-test (Wilcoxon, n = 8 donors). For e, f and g, each coloured dot represents a different donor, red shades indicate SPTV (n = 3) and the blue shades indicate SPT-VI (n = 3–5). (h) Example of S. basale KC showing basal PCNT co-location with melanin in SPT-VI skin. Scale bar = 20 µm unless indicated otherwise. Nuclei were counterstained with DAPI. Basement membrane is shown with a dotted white line.
Figure 6
Figure 6
Methodology for assigning apical, perinuclear/central or basal subcellular localisation of KC’s organelles (i.e., melanin granules, PCNT and PCM1) in the S. basale. KC, keratinocyte; MC, melanocyte.

References

    1. Kobayashi N., Nakagawa A., Muramatsu T., Yamashina Y., Shirai T., Hashimoto M.W., Ishigaki Y., Ohnishi T., Mori T. Supranuclear Melanin Caps Reduce Ultraviolet Induced DNA Photoproducts in Human Epidermis. J. Investig. Dermatol. 1998;110:806–810. doi: 10.1046/j.1523-1747.1998.00178.x. - DOI - PubMed
    1. Fajuyigbe D., Lwin S.M., Diffey B.L., Baker R., Tobin D.J., Sarkany R.P.E., Young A.R. Melanin distribution in human epidermis affords localized protection against DNA photodamage and concurs with skin cancer incidence difference in extreme phototypes. FASEB J. 2018;32:3700–3706. doi: 10.1096/fj.201701472R. - DOI - PubMed
    1. Byers H.R., Maheshwary S., Amodeo D.M., Dykstra S.G. Role of cytoplasmic dynein in perinuclear aggregation of phagocytosed melanosomes and supranuclear melanin cap formation in human keratinocytes. J. Investig. Dermatol. 2003;121:813–820. doi: 10.1046/j.1523-1747.2003.12481.x. - DOI - PubMed
    1. Joly-Tonetti N., Wibawa J.I.D., Bell M., Tobin D.J. An explanation for the mysterious distribution of melanin in human skin—A rare example of asymmetric (melanin) organelle distribution during mitosis of basal layer progenitor keratinocytes. Br. J. Dermatol. 2018;179 doi: 10.1111/bjd.16926. - DOI - PubMed
    1. Correia M.S., Moreiras H., Pereira F.J.C., Neto M.V., Festas T.C., Tarafder A.K., Ramalho J.S., Seabra M.C., Barral D.C. Melanin Transferred to Keratinocytes Resides in Nondegradative Endocytic Compartments. J. Investig. Derm. 2018;138:637–646. doi: 10.1016/j.jid.2017.09.042. - DOI - PubMed

LinkOut - more resources