

Plant-Derived Trans-β-Caryophyllene Boosts Glucose Metabolism and ATP Synthesis in Skeletal Muscle Cells through Cannabinoid Type 2 Receptor Stimulation
- PMID: 33809114
- PMCID: PMC7999495
- DOI: 10.3390/nu13030916
Plant-Derived Trans-β-Caryophyllene Boosts Glucose Metabolism and ATP Synthesis in Skeletal Muscle Cells through Cannabinoid Type 2 Receptor Stimulation
Abstract
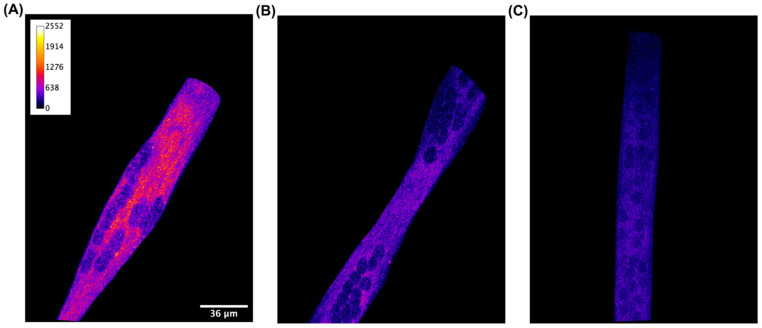
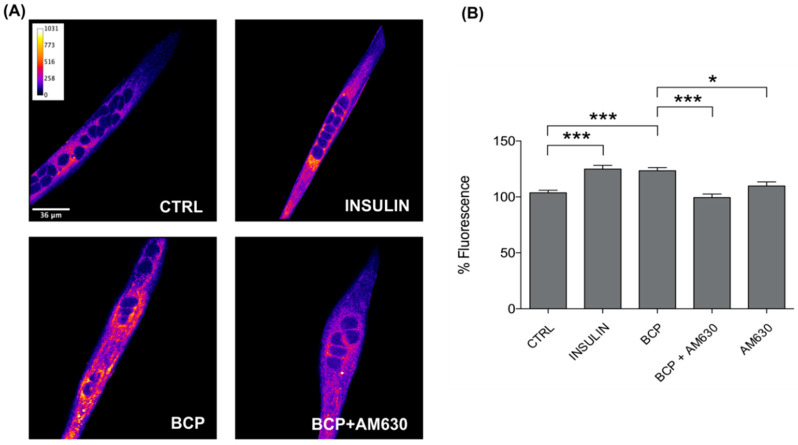
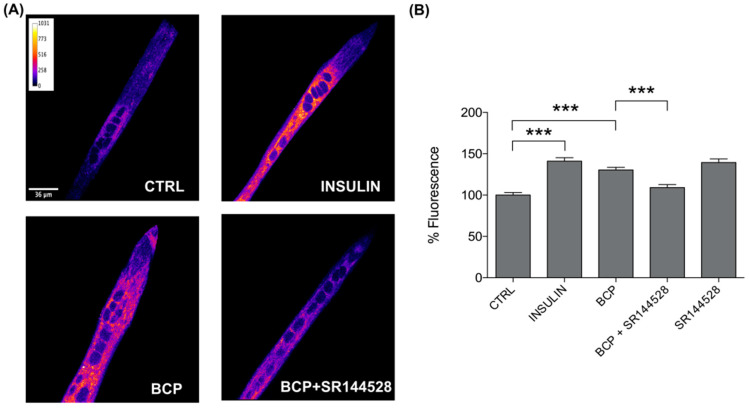
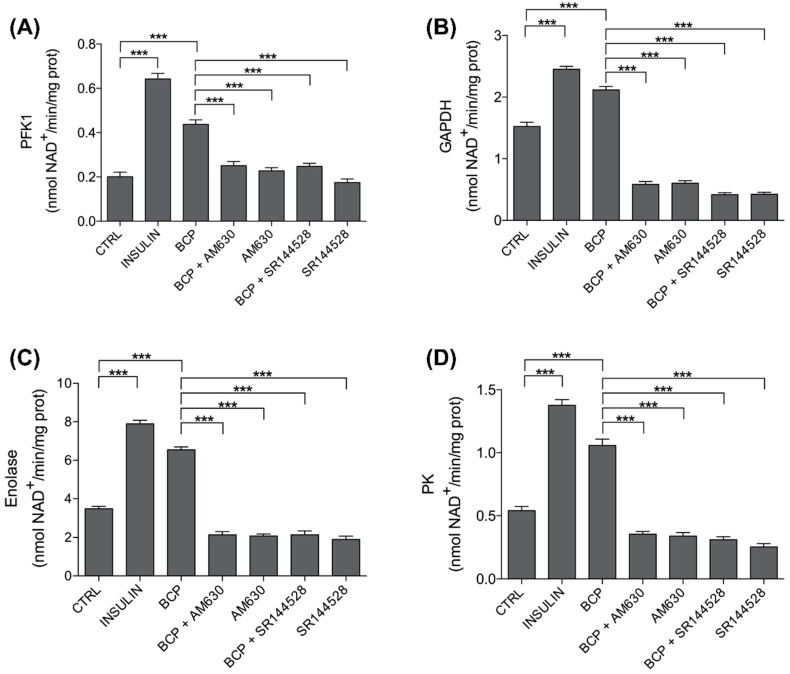
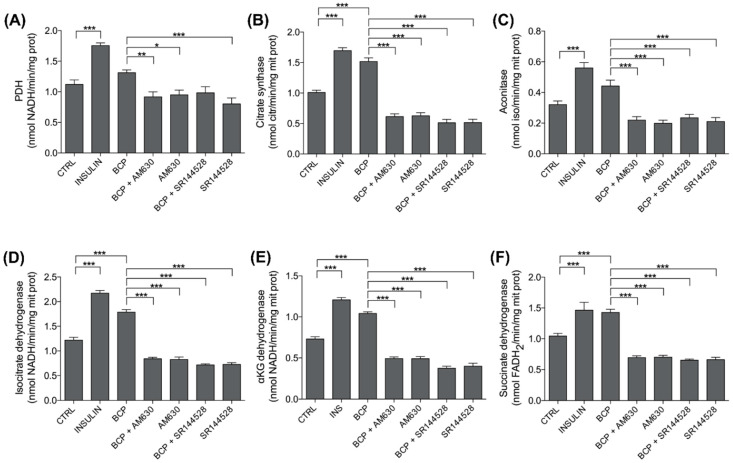
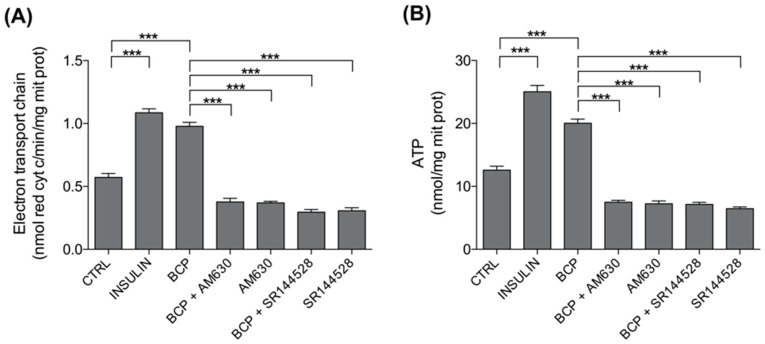
Skeletal muscle plays a pivotal role in whole-body glucose metabolism, accounting for the highest percentage of glucose uptake and utilization in healthy subjects. Impairment of these key functions occurs in several conditions including sedentary lifestyle and aging, driving toward hyperglycemia and metabolic chronic diseases. Therefore, strategies pointed to improve metabolic health by targeting skeletal muscle biochemical pathways are extremely attractive. Among them, we focused on the natural sesquiterpene and cannabinoid type 2 (CB2) receptor agonist Trans-β-caryophyllene (BCP) by analyzing its role in enhancing glucose metabolism in skeletal muscle cells. Experiments were performed on C2C12 myotubes. CB2 receptor membrane localization in myotubes was assessed by immunofluorescence. Within glucose metabolism, we evaluated glucose uptake (by the fluorescent glucose analog 2-NBDG), key enzymes of both glycolytic and oxidative pathways (by spectrophotometric assays and metabolic radiolabeling) and ATP production (by chemiluminescence-based assays). In all experiments, CB2 receptor involvement was tested with the CB2 antagonists AM630 and SR144528. Our results show that in myotubes, BCP significantly enhances glucose uptake, glycolytic and oxidative pathways, and ATP synthesis through a CB2-dependent mechanism. Giving these outcomes, CB2 receptor stimulation by BCP could represent an appealing tool to improve skeletal muscle glucose metabolism, both in physiological and pathological conditions.
Keywords: cannabinoid type 2 receptor; glucose metabolism; glucose uptake; trans-β-caryophyllene.
Conflict of interest statement
The authors declare no conflict of interest.
Figures
Similar articles
-
PipeNig®-FL, a Fluid Extract of Black Pepper (Piper Nigrum L.) with a High Standardized Content of Trans-β-Caryophyllene, Reduces Lipid Accumulation in 3T3-L1 Preadipocytes and Improves Glucose Uptake in C2C12 Myotubes.Nutrients. 2019 Nov 15;11(11):2788. doi: 10.3390/nu11112788. Nutrients. 2019. PMID: 31731718 Free PMC article.
-
Activation of cannabinoid type 2 receptor protects skeletal muscle from ischemia-reperfusion injury partly via Nrf2 signaling.Life Sci. 2019 Aug 1;230:55-67. doi: 10.1016/j.lfs.2019.05.056. Epub 2019 May 22. Life Sci. 2019. PMID: 31128135
-
β-Caryophyllene, a natural bicyclic sesquiterpene attenuates doxorubicin-induced chronic cardiotoxicity via activation of myocardial cannabinoid type-2 (CB2) receptors in rats.Chem Biol Interact. 2019 May 1;304:158-167. doi: 10.1016/j.cbi.2019.02.028. Epub 2019 Mar 2. Chem Biol Interact. 2019. PMID: 30836069
-
A focused review on CB2 receptor-selective pharmacological properties and therapeutic potential of β-caryophyllene, a dietary cannabinoid.Biomed Pharmacother. 2021 Aug;140:111639. doi: 10.1016/j.biopha.2021.111639. Epub 2021 Jun 3. Biomed Pharmacother. 2021. PMID: 34091179 Review.
-
Protective Effects of (E)-β-Caryophyllene (BCP) in Chronic Inflammation.Nutrients. 2020 Oct 26;12(11):3273. doi: 10.3390/nu12113273. Nutrients. 2020. PMID: 33114564 Free PMC article. Review.
Cited by
-
Beta-Caryophyllene Modifies Intracellular Lipid Composition in a Cell Model of Hepatic Steatosis by Acting through CB2 and PPAR Receptors.Int J Mol Sci. 2023 Mar 23;24(7):6060. doi: 10.3390/ijms24076060. Int J Mol Sci. 2023. PMID: 37047034 Free PMC article.
-
Exploring the potential of Laportea decumana extract compounds as COX-1 and COX-2 inhibitors: An in silico study.Narra J. 2025 Apr;5(1):e1627. doi: 10.52225/narra.v5i1.1627. Epub 2025 Mar 23. Narra J. 2025. PMID: 40352214 Free PMC article.
-
Antidiabetic Potential of Volatile Cinnamon Oil: A Review and Exploration of Mechanisms Using In Silico Molecular Docking Simulations.Molecules. 2022 Jan 27;27(3):853. doi: 10.3390/molecules27030853. Molecules. 2022. PMID: 35164117 Free PMC article. Review.
-
Pharmacology of Non-Psychoactive Phytocannabinoids and Their Potential for Treatment of Cardiometabolic Disease.Handb Exp Pharmacol. 2025;287:61-93. doi: 10.1007/164_2024_731. Handb Exp Pharmacol. 2025. PMID: 39235486 Review.
-
Trimetazidine Attenuates Heart Failure by Improving Myocardial Metabolism via AMPK.Front Pharmacol. 2021 Sep 15;12:707399. doi: 10.3389/fphar.2021.707399. eCollection 2021. Front Pharmacol. 2021. PMID: 34603021 Free PMC article.
References
MeSH terms
Substances
Grants and funding
LinkOut - more resources
Full Text Sources
Other Literature Sources
