. 2021 Mar 12;22(6):2885.
doi: 10.3390/ijms22062885.

An Insight into the Stages of Ion Leakage during Red Blood Cell Storage

Affiliations

An Insight into the Stages of Ion Leakage during Red Blood Cell Storage

Anna Zimna et al. Int J Mol Sci. .

Abstract

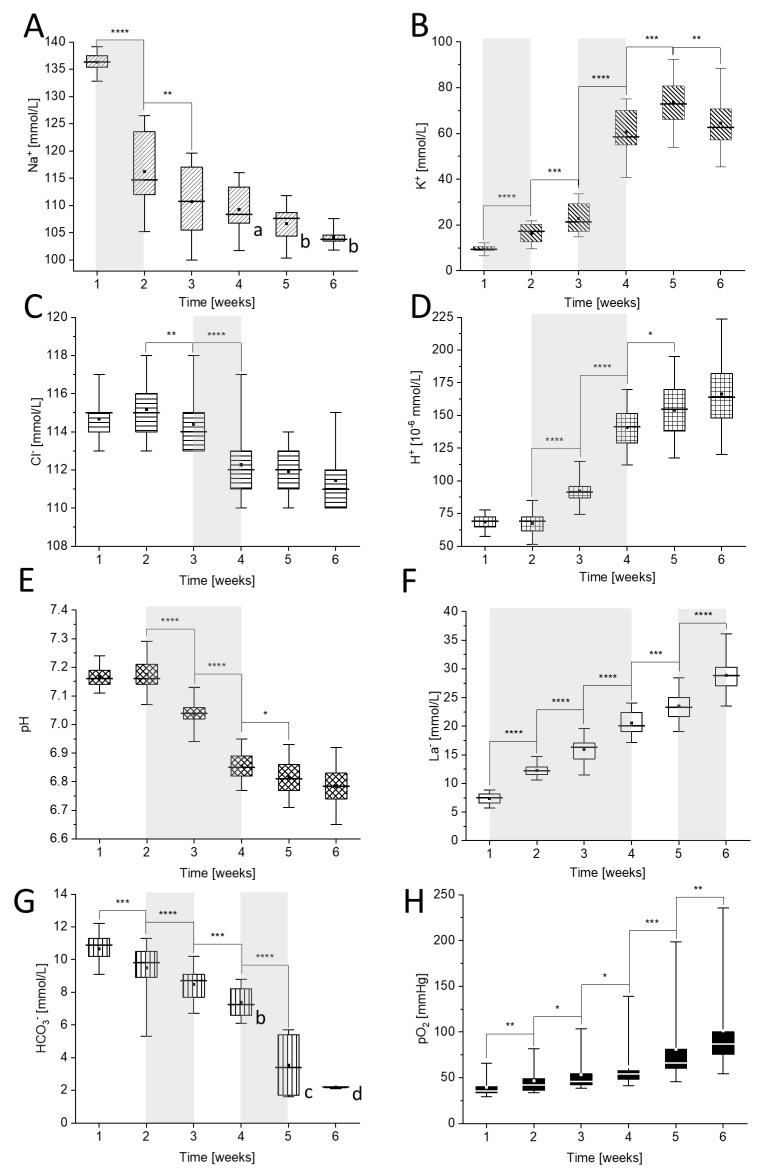
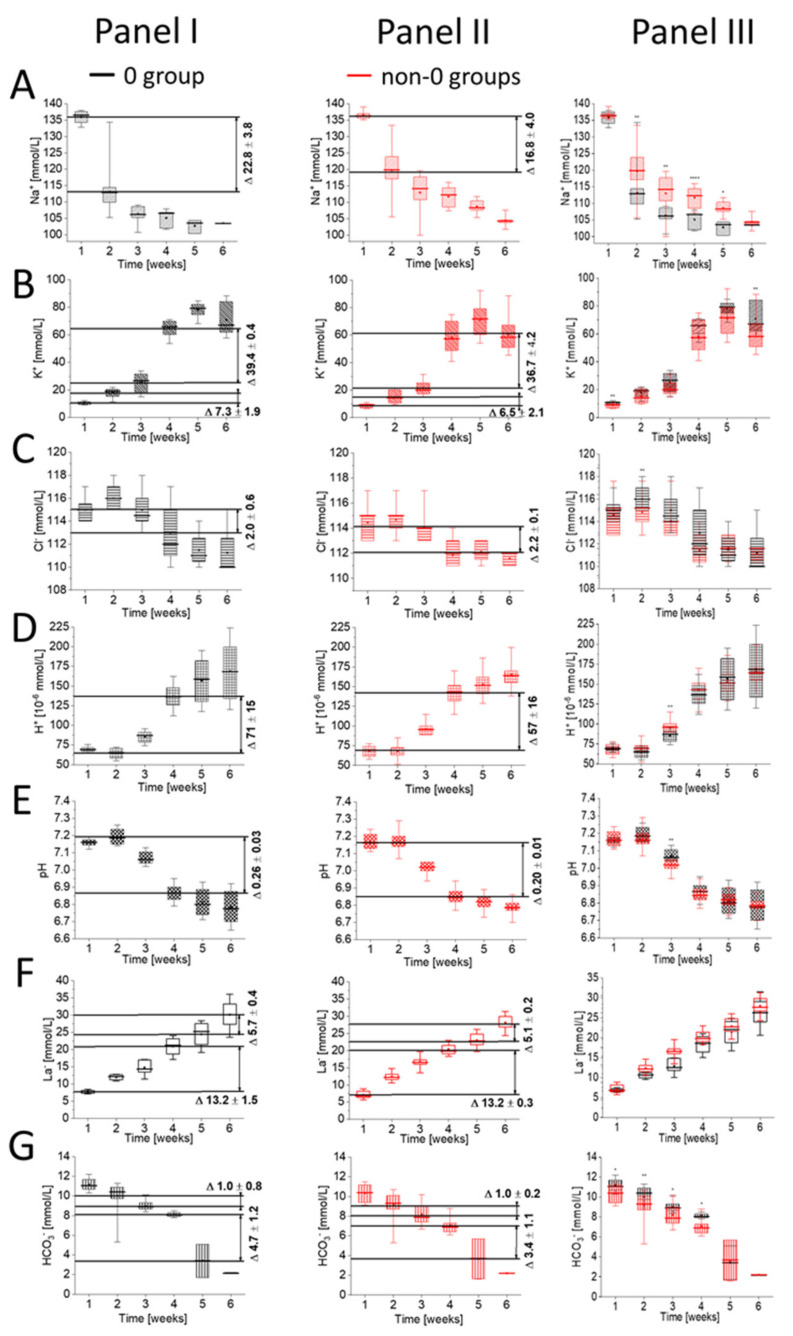
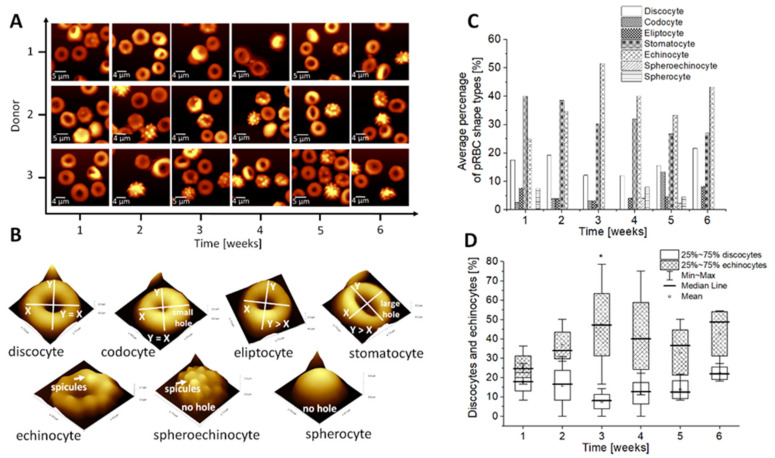
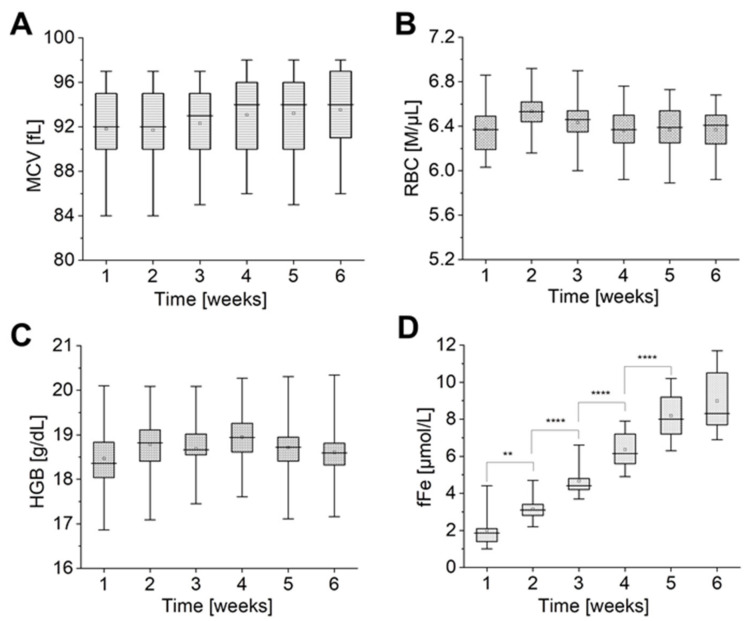
Packed red blood cells (pRBCs), the most commonly transfused blood product, are exposed to environmental disruptions during storage in blood banks. In this study, temporal sequence of changes in the ion exchange in pRBCs was analyzed. Standard techniques commonly used in electrolyte measurements were implemented. The relationship between ion exchange and red blood cells (RBCs) morphology was assessed with use of atomic force microscopy with reference to morphological parameters. Variations observed in the Na+, K+, Cl-, H+, HCO3-, and lactate ions concentration show a complete picture of singly-charged ion changes in pRBCs during storage. Correlation between the rate of ion changes and blood group type, regarding the limitations of our research, suggested, that group 0 is the most sensitive to the time-dependent ionic changes. Additionally, the impact of irreversible changes in ion exchange on the RBCs membrane was observed in nanoscale. Results demonstrate that the level of ion leakage that leads to destructive alterations in biochemical and morphological properties of pRBCs depend on the storage timepoint.

Keywords: atomic force microscopy; membrane ions transport; red blood cell; red cell aging.


Conflict of interest statement

The authors declare no conflict of interest.

Figures

Figure 1
Figure 1
Time-dependent changes in: (A) [Na+], (B) [K+], (C) [Cl], (D) [H+], (E) pH, (F) [La], (G) [HCO3], and (H) pO2 during storage of packed red blood cells (pRBCs). Measurements were carried out weekly for six weeks. Letters a–d mark the results obtained for the following number of donors: (a) n = 8, (b) n = 7, (c) n = 4, (d) n = 2, while other were obtained from eleven donors (n = 11). The most prominent changes are marked gray. Data distribution is presented as box plots: median, Q1, Q3, interquartile range and min-max whiskers (Q1, Q3 indicate 25th and 75th percentiles, respectively). Data normality distribution was assessed using Shapiro-Wilk test. Statistical significance of the obtained values was tested with Kruskal-Wallis ANOVA nonparametric test (null = not significant; * p < 0.05; ** p < 0.01, *** p < 0.001, **** p < 0.0001).
Figure 2
Figure 2
Comparison of time-dependent changes in (A) Na+, (B) K+, (C) Cl-, (D) H+, (E) pH, (F) La and (G) HCO3 concentrations between 0 (Panel I) and non-0 (Panel II) blood groups with the difference of values (∆) marked for each measured parameter in ranges marked in gray in Figure 1, which correspond only to substantial concentration changes (p < 10−4). Results are given for n = 4 (group 0) and n = 7 (group non-0). The non-0 group contains pRBCs obtained from the donors with A group (n = 4) and with B group (n = 1) and AB group (n = 2). Data distribution is presented as box plots: median, Q1, Q3, interquartile range, and min-max whiskers (Q1, Q3 indicate 25th and 75th percentiles, respectively). Data normality distribution was assessed using Shapiro-Wilk test. Panel III—Statistical significance of the obtained values for 0 and non-0 groups in each week was tested with KruskalWallis ANOVA nonparametric test (null = not significant; * p < 0.05; ** p < 0.01, *** p < 0.001, **** p < 0.0001).
Figure 3
Figure 3
(A) Representative 2D AFM images obtained during analysis of dry smears; (B) Example of 3D AFM images of different red blood cell (RBC) shape types observed during storage; (C) Time-dependent changes of the discocytes and stomatocytes observed weekly for six weeks of storage in pRBCs. Data distribution is presented as box plots (median, Q1, Q3, interquartile range, min-max whiskers). Q1, Q3 indicate 25th and 75th percentiles, respectively. Statistical significance of the obtained data (n = 3) was tested with Kruskal-Wallis ANOVA nonparametric test followed by Tukey’s post-hoc (*p < 0.05); (D) Analysis of RBC shape types as presented in (B) based on nanoscale AFM measurements analyzed weekly during six weeks of storage of pRBCs (n = 3). Besides statistically significant difference between discocytes and stomatocytes presented in (C) for the second week of storage, other results in (D) were found not significant.
Figure 4
Figure 4
Time-dependent changes in red cell quality indices: (A) mean corpuscular volume (MCV), (B) RBC and (C) haemoglobin concentration (HGB) and (D) fFe during pRBCs storage (n = 11). Data distribution is presented as box plots: median, Q1, Q3, interquartile range, and min-max whiskers (Q1, Q3 indicate 25th and 75th percentiles, respectively). Data normality distribution was assessed using Shapiro-Wilk test. Statistical significance of the obtained values was tested with Kruskal-Wallis ANOVA nonparametric test (null = not significant; ** p < 0.01, **** p < 0.0001).

Similar articles

Cited by

References

    1. Gevorkian S., Allahverdyan A., Gevorgyan D., Ma W.-J., Hu C.-K. Can morphological changes of erythrocytes be driven by hemoglobin? Phys. A Stat. Mech. Appl. 2018;508:608–612. doi: 10.1016/j.physa.2018.05.118. - DOI
    1. Lux S.E. Anatomy of the red cell membrane skeleton: Unanswered questions. Blood. 2016;127:187–199. doi: 10.1182/blood-2014-12-512772. - DOI - PubMed
    1. De Rosa M.C., Alinovi C.C., Galtieri A., Scatena R., Giardina B. The plasma membrane of erythrocytes plays a fundamental role in the transport of oxygen, carbon dioxide and nitric oxide and in the maintenance of the reduced state of the heme iron. Gene. 2007;398:162–171. doi: 10.1016/j.gene.2007.02.048. - DOI - PubMed
    1. Mazzulla S., Schella A., Gabriele D., Baldino N., Sesti S., Perrotta E., Costabile A., De Cindio B. Oxidation of human red blood cells by a free radical initiator: Effects on rheological properties. Clin. Hemorheol. Microcirc. 2015;60:375–388. doi: 10.3233/CH-141841. - DOI - PubMed
    1. Kuhn V., Diederich L., Keller T.S., Kramer C.M., Lückstädt W., Panknin C., Suvorava T., Isakson B.E., Kelm M., Cortese-Krott M.M. Red Blood Cell Function and Dysfunction: Redox Regulation, Nitric Oxide Metabolism, Anemia. Antioxid. Redox Signal. 2017;26:718–742. doi: 10.1089/ars.2016.6954. - DOI - PMC - PubMed

LinkOut - more resources