

Racial and Ethnic Disparities in Years of Potential Life Lost Attributable to COVID-19 in the United States: An Analysis of 45 States and the District of Columbia
- PMID: 33809240
- PMCID: PMC8000338
- DOI: 10.3390/ijerph18062921
Racial and Ethnic Disparities in Years of Potential Life Lost Attributable to COVID-19 in the United States: An Analysis of 45 States and the District of Columbia
Abstract
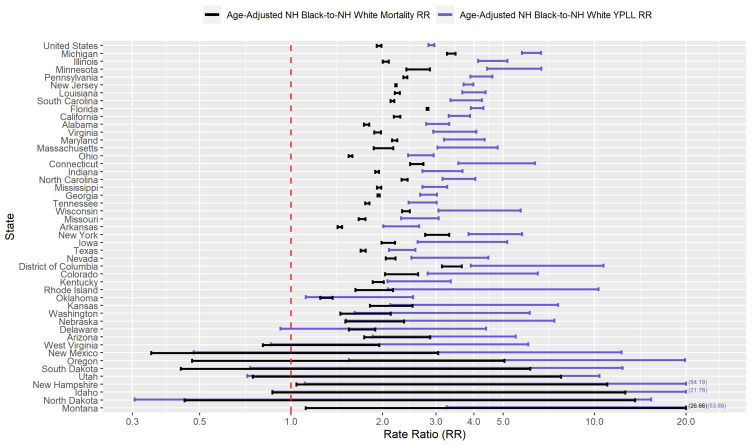
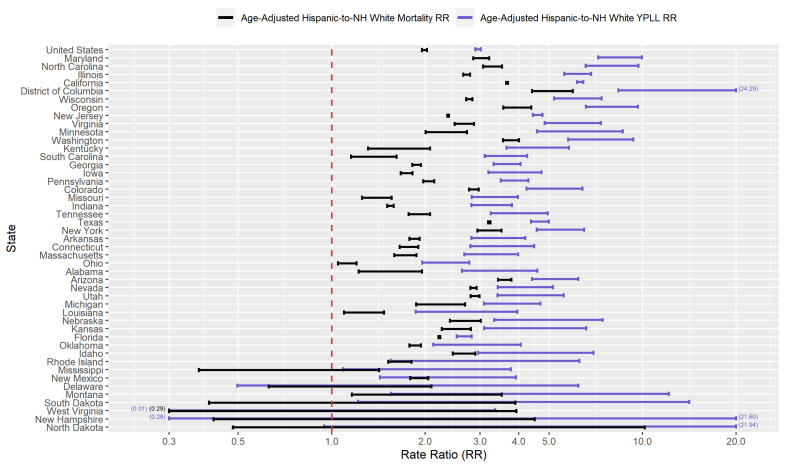
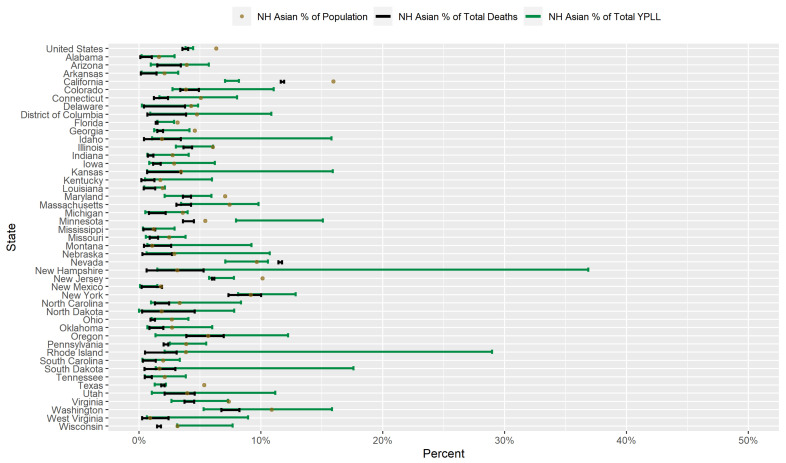
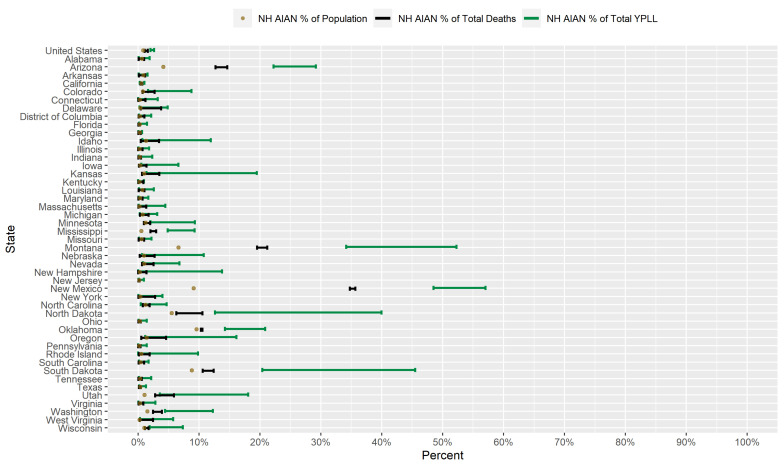
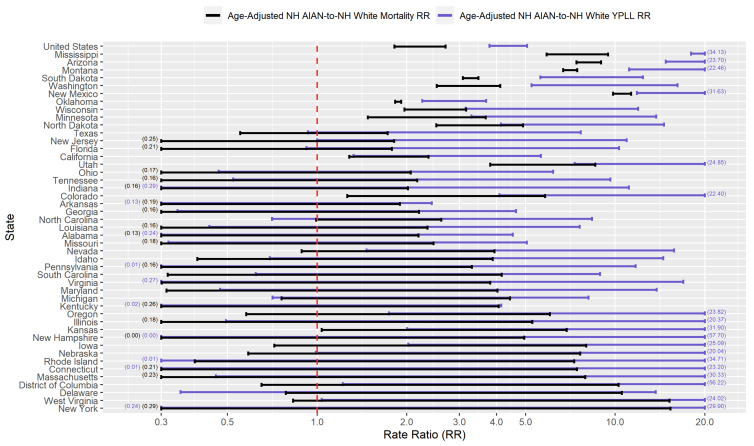
The coronavirus disease 2019 (COVID-19) epidemic in the United States has disproportionately impacted communities of color across the country. Focusing on COVID-19-attributable mortality, we expand upon a national comparative analysis of years of potential life lost (YPLL) attributable to COVID-19 by race/ethnicity (Bassett et al., 2020), estimating percentages of total YPLL for non-Hispanic Whites, non-Hispanic Blacks, Hispanics, non-Hispanic Asians, and non-Hispanic American Indian or Alaska Natives, contrasting them with their respective percent population shares, as well as age-adjusted YPLL rate ratios-anchoring comparisons to non-Hispanic Whites-in each of 45 states and the District of Columbia using data from the National Center for Health Statistics as of 30 December 2020. Using a novel Monte Carlo simulation procedure to perform estimation, our results reveal substantial racial/ethnic disparities in COVID-19-attributable YPLL across states, with a prevailing pattern of non-Hispanic Blacks and Hispanics experiencing disproportionately high and non-Hispanic Whites experiencing disproportionately low COVID-19-attributable YPLL. Furthermore, estimated disparities are generally more pronounced when measuring mortality in terms of YPLL compared to death counts, reflecting the greater intensity of the disparities at younger ages. We also find substantial state-to-state variability in the magnitudes of the estimated racial/ethnic disparities, suggesting that they are driven in large part by social determinants of health whose degree of association with race/ethnicity varies by state.
Keywords: COVID-19; Monte Carlo simulation; SARS-CoV-2; communities of color; coronavirus; medical mistrust; public health; racial and ethnic disparities; social determinants of health; years of potential life lost.
Conflict of interest statement
T.R.B. has received support from NIH/NCATS grant UL1 TR001881 and NIH/NIMH grant P30 MH058107 in addition to funding outside the scope of this work from the Patient Centered Outcomes Research Institute and the Movember Foundation. M.A.S. has received contracts from Janssen Research & Development, LLC; Private Health Management, Inc.; the United States Department of Veteran Affairs; and the United States Food & Drug Administration and research grants from the National Institutes of Health, all outside the scope of this work. C.M.R. has received a contract from Private Health Management, Inc. outside the scope of this work.
Figures


Similar articles
-
Male-Female Disparities in Years of Potential Life Lost Attributable to COVID-19 in the United States: A State-by-State Analysis.medRxiv [Preprint]. 2021 May 5:2021.05.02.21256495. doi: 10.1101/2021.05.02.21256495. medRxiv. 2021. PMID: 33972951 Free PMC article. Updated. Preprint.
-
Counties with High COVID-19 Incidence and Relatively Large Racial and Ethnic Minority Populations - United States, April 1-December 22, 2020.MMWR Morb Mortal Wkly Rep. 2021 Apr 2;70(13):483-489. doi: 10.15585/mmwr.mm7013e1. MMWR Morb Mortal Wkly Rep. 2021. PMID: 33793463 Free PMC article.
-
Variation in racial/ethnic disparities in COVID-19 mortality by age in the United States: A cross-sectional study.PLoS Med. 2020 Oct 20;17(10):e1003402. doi: 10.1371/journal.pmed.1003402. eCollection 2020 Oct. PLoS Med. 2020. PMID: 33079941 Free PMC article.
-
COVID-19 And Racial/Ethnic Disparities In Health Risk, Employment, And Household Composition.Health Aff (Millwood). 2020 Sep;39(9):1624-1632. doi: 10.1377/hlthaff.2020.00897. Epub 2020 Jul 14. Health Aff (Millwood). 2020. PMID: 32663045 Review.
-
Years of potential life lost and productivity losses from male urogenital cancer deaths--United States, 2004.Urology. 2010 Sep;76(3):528-35. doi: 10.1016/j.urology.2010.04.030. Epub 2010 Jun 22. Urology. 2010. PMID: 20573389 Review.
Cited by
-
Male-Female Disparities in Years of Potential Life Lost Attributable to COVID-19 in the United States: A State-by-State Analysis.medRxiv [Preprint]. 2021 May 5:2021.05.02.21256495. doi: 10.1101/2021.05.02.21256495. medRxiv. 2021. PMID: 33972951 Free PMC article. Updated. Preprint.
-
The American Heart Association Emergency Cardiovascular Care 2030 Impact Goals and Call to Action to Improve Cardiac Arrest Outcomes: A Scientific Statement From the American Heart Association.Circulation. 2024 Feb 20;149(8):e914-e933. doi: 10.1161/CIR.0000000000001196. Epub 2024 Jan 22. Circulation. 2024. PMID: 38250800 Free PMC article. Review.
-
Rapid growth in the COVID-19 era.MRS Bull. 2021;46(9):847-853. doi: 10.1557/s43577-021-00185-2. Epub 2021 Sep 29. MRS Bull. 2021. PMID: 34608355 Free PMC article. Review.
-
Infection fatality rate of COVID-19 in community-dwelling elderly populations.Eur J Epidemiol. 2022 Mar;37(3):235-249. doi: 10.1007/s10654-022-00853-w. Epub 2022 Mar 20. Eur J Epidemiol. 2022. PMID: 35306604 Free PMC article.
-
Bridging social capital among Facebook users and COVID-19 cases growth in Arizona.Soc Sci Med. 2024 Nov;360:117313. doi: 10.1016/j.socscimed.2024.117313. Epub 2024 Sep 12. Soc Sci Med. 2024. PMID: 39270574 Review.
References
-
- First Patient With Wuhan Coronavirus Is Identified in the U.S. [(accessed on 15 February 2021)]; Available online: https://www.nytimes.com/2020/01/21/health/cdc-coronavirus.html.
MeSH terms
LinkOut - more resources
Full Text Sources
Other Literature Sources
Medical
Miscellaneous
