

Characterization of the COPD Salivary Fingerprint through Surface Enhanced Raman Spectroscopy: A Pilot Study
- PMID: 33809282
- PMCID: PMC7999017
- DOI: 10.3390/diagnostics11030508
Characterization of the COPD Salivary Fingerprint through Surface Enhanced Raman Spectroscopy: A Pilot Study
Abstract
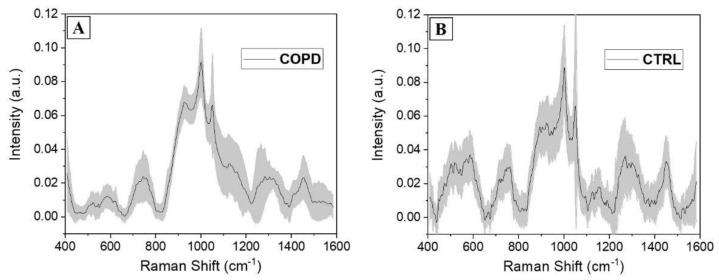
Chronic Obstructive Pulmonary Disease (COPD) is a debilitating pathology characterized by reduced lung function, breathlessness and rapid and unrelenting decrease in quality of life. The severity rate and the therapy selection are strictly dependent on various parameters verifiable after years of clinical observations, missing a direct biomarker associated with COPD. In this work, we report the methodological application of Surface Enhanced Raman Spectroscopy combined with Multivariate statistics for the analysis of saliva samples collected from 15 patients affected by COPD and 15 related healthy subjects in a pilot study. The comparative Raman analysis allowed to determine a specific signature of the pathological saliva, highlighting differences in determined biological species, already studied and characterized in COPD onset, compared to the Raman signature of healthy samples. The unsupervised principal component analysis and hierarchical clustering revealed a sharp data dispersion between the two experimental groups. Using the linear discriminant analysis, we created a classification model able to discriminate the collected signals with accuracies, specificities, and sensitivities of more than 98%. The results of this preliminary study are promising for further applications of Raman spectroscopy in the COPD clinical field.
Keywords: COPD; SERS; multivariate analysis; saliva.
Conflict of interest statement
The authors declare no conflict of interest.
Figures


Similar articles
-
Utility of Raman Spectroscopy in Pulmonary Medicine.Adv Respir Med. 2024 Oct 18;92(5):421-428. doi: 10.3390/arm92050038. Adv Respir Med. 2024. PMID: 39452060 Free PMC article. Review.
-
Identification of the Raman Salivary Fingerprint of Parkinson's Disease Through the Spectroscopic- Computational Combinatory Approach.Front Neurosci. 2021 Oct 26;15:704963. doi: 10.3389/fnins.2021.704963. eCollection 2021. Front Neurosci. 2021. PMID: 34764849 Free PMC article.
-
Noninvasive detection of nasopharyngeal carcinoma based on saliva proteins using surface-enhanced Raman spectroscopy.J Biomed Opt. 2017 Oct;22(10):1-6. doi: 10.1117/1.JBO.22.10.105004. J Biomed Opt. 2017. PMID: 29030944
-
Non-invasive detection of nasopharyngeal carcinoma using saliva surface-enhanced Raman spectroscopy.Oncol Lett. 2016 Jan;11(1):884-890. doi: 10.3892/ol.2015.3969. Epub 2015 Nov 24. Oncol Lett. 2016. PMID: 26870300 Free PMC article.
-
A narrative review of exploring potential salivary biomarkers in respiratory diseases: still on its way.J Thorac Dis. 2021 Jul;13(7):4541-4553. doi: 10.21037/jtd-21-202. J Thorac Dis. 2021. PMID: 34422380 Free PMC article. Review.
Cited by
-
Utility of Raman Spectroscopy in Pulmonary Medicine.Adv Respir Med. 2024 Oct 18;92(5):421-428. doi: 10.3390/arm92050038. Adv Respir Med. 2024. PMID: 39452060 Free PMC article. Review.
-
Biochemical Characterization of Human Salivary Extracellular Vesicles as a Valuable Source of Biomarkers.Biology (Basel). 2023 Jan 31;12(2):227. doi: 10.3390/biology12020227. Biology (Basel). 2023. PMID: 36829504 Free PMC article.
-
Detection of Respiratory Disease Based on Surface-Enhanced Raman Scattering and Multivariate Analysis of Human Serum.Diagnostics (Basel). 2025 Mar 8;15(6):660. doi: 10.3390/diagnostics15060660. Diagnostics (Basel). 2025. PMID: 40150003 Free PMC article.
-
Identification of the Raman Salivary Fingerprint of Parkinson's Disease Through the Spectroscopic- Computational Combinatory Approach.Front Neurosci. 2021 Oct 26;15:704963. doi: 10.3389/fnins.2021.704963. eCollection 2021. Front Neurosci. 2021. PMID: 34764849 Free PMC article.
References
-
- Caramori G., Casolari P., Carone M., Bertorelli G., Banfi P., Andò F. Personalised treatment of stable COPD patients. Rass. Patol. Appar. Respir. 2016;31:83–90.
-
- WHO . Global Initiative for Chronic Obstructive Lung Disease. WHO; Geneva, Switzerland: 2019.
Grants and funding
LinkOut - more resources
Full Text Sources
Other Literature Sources
Miscellaneous
