. 2021 Mar 12;22(6):2909.
doi: 10.3390/ijms22062909.

Multiple Sclerosis-Associated hnRNPA1 Mutations Alter hnRNPA1 Dynamics and Influence Stress Granule Formation

Affiliations

Multiple Sclerosis-Associated hnRNPA1 Mutations Alter hnRNPA1 Dynamics and Influence Stress Granule Formation

Joseph-Patrick W E Clarke et al. Int J Mol Sci. .

Abstract

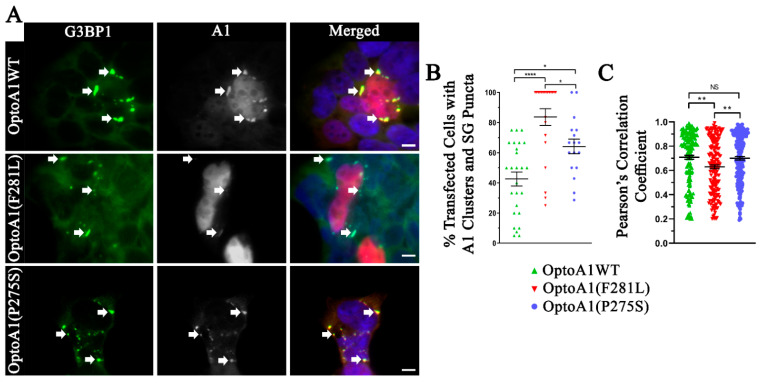
Evidence indicates that dysfunctional heterogeneous ribonucleoprotein A1 (hnRNPA1; A1) contributes to the pathogenesis of neurodegeneration in multiple sclerosis. Understanding molecular mechanisms of neurodegeneration in multiple sclerosis may result in novel therapies that attenuate neurodegeneration, thereby improving the lives of MS patients with multiple sclerosis. Using an in vitro, blue light induced, optogenetic protein expression system containing the optogene Cryptochrome 2 and a fluorescent mCherry reporter, we examined the effects of multiple sclerosis-associated somatic A1 mutations (P275S and F281L) in A1 localization, cluster kinetics and stress granule formation in real-time. We show that A1 mutations caused cytoplasmic mislocalization, and significantly altered the kinetics of A1 cluster formation/dissociation, and the quantity and size of clusters. A1 mutations also caused stress granule formation to occur more quickly and frequently in response to blue light stimulation. This study establishes a live cell optogenetics imaging system to probe localization and association characteristics of A1. It also demonstrates that somatic mutations in A1 alter its function and promote stress granule formation, which supports the hypothesis that A1 dysfunction may exacerbate neurodegeneration in multiple sclerosis.

Keywords: hnRNPA1; multiple sclerosis; mutations; optogenetics; stress granules.


Conflict of interest statement

The authors of this study have no current or past relationships with commercial entities, and the information contained within is not currently nor previously funded by commercial entities.

Figures

Figure 1
Figure 1
MS-associated A1 mutations F281L and P275S are mislocalized to the cytoplasm. Immunofluorescence of non-stimulated, HEK293Tcells expressing optogenetic fusion proteins of (A) full-length, wild-type A1 (OptoA1WT), (B) A1(F281L) (OptoA1(F281L)), (C) A1(P275S) (OptoA1(P275S)) and (D) Opto-mCh 12 h post-transfection. The cytoplasm is delineated by staining for G3BP1 (green), while nuclei are outlined (white outlines) using DAPI staining in merged images. Scale bars = 5 µm. (E) Cytoplasmic/nuclear fluorescence intensity ratio analysis of OptoA1 fusion proteins and Opto-mCh. The experimental ratios of five fields of view, per three independent experiments, were quantified and graphed in jitter plots, demonstrating that no one experiment drove the variation. Data shown are mean ± S.E.M. for three biological replicates. One-way ANOVA, with a Tukey post hoc test, was performed to indicate significance. **** p < 0.0001.
Figure 2
Figure 2
OptoA1WT responds differently to BL stimulation as compared to A1WT-mCh, Opto-mCh and OptoA1(PrLD). (A) Schematic of BL-inducible A1 self-association using the Cry2PHR optogene (blue), A1 protein (green) and mCh fluorescent tag (red). (B) Quantification of A1 cluster formation and dissociation during and following a BL stimulation protocol. HEK293T cells expressing OptoA1WT (green), A1WT-mCh (orange), Opto-mCh (magenta), or OptoA1(PrLD) (yellow) were exposed to BL stimulation (10,000 lux, 465 nm) for 120 min followed by 60 min of non-stimulation. Results are plotted as a percent maximum to the highest cluster response at 120 min for each OptoA1 construct, resulting in a kinetics curve for association and dissociation dynamics. Dashed lines indicate KA1/2Max, while dash-dotted lines indicate KD1/2Max. Data shown are mean ± S.E.M. for three biological replicates. Representative images of BL stimulated cells transfected with A1WT-mCh (C), OptoA1WT (D), Opto-mCh (E) and Opto-A1(PrLD) (F) are shown. Since Opto-A1(PrLD) forms clusters within minutes of BL exposure, both a long and short BL stimulation timeframe is shown in (F). Arrows indicate the formation of OptoA1 clusters. Stars indicate cells with Opto-mCh cluster (non-A1) formation. Scale bars = 5 µm. * p < 0.05; ** p < 0.01; **** p < 0.0001.
Figure 3
Figure 3
OptoA1(F281L) and OptoA1(P275S) mutants affect A1 self-association dynamics and characteristics. (Ai) and (Aii) Quantification of mutant A1 cluster formation and dissociation during and following a BL stimulation protocol. HEK293T cells expressing OptoA1WT (Ai, Aii; similar data used from Figure 2B), OptoA1(F281L) (Ai), or OptoA1(P275S) (Aii) were exposed to BL stimulation (10,000 lux, 465 nm) for 120 min followed by 60 min of non-stimulation. Results are plotted as a percent maximum to the highest cluster response at 120 min for each OptoA1 construct, resulting in a kinetics curve for association and dissociation dynamics. Curves are the result of three independent experiments. Dashed lines indicate KA1/2Max, while dash-dotted lines indicate KD1/2Max. Two-way ANOVA, with a Bonferroni post hoc test, was performed to indicate significance on kinetics curves. (B) and (C) Representative images of BL stimulated OptoA1(F281L) and OptoA1(P275S) clusters, respectively. Arrows indicate the formation of OptoA1 clusters. Scale bars = 5 µm. (D) Quantification of BL stimulated OptoA1 clusters per cell at peak stimulation (120 min of BL ON) combined from three biological experiments. (E) Quantification of BL stimulated OptoA1 clusters sizes at peak stimulation (120 min of BL ON) combined from three biological experiments. One-way ANOVA, with a Tukey post hoc test, was performed to indicate significance between cluster number and sizes. Data shown are mean ± S.E.M. for three biological replicates. * p < 0.05; ** p < 0.01; *** p < 0.001; **** p < 0.0001.
Figure 4
Figure 4
Cells containing OptoA1(F281L) and OptoA1(P275S) mutant clusters have more SG formation and altered A1 to SG co-localization. (A) Immunofluorescence of 120-min BL stimulated HEK293T cells expressing OptoA1WT, OptoA1(F281L) and OptoA1(P275S) constructs (grey), co-staining for endogenous G3BP1-positive SGs (green). DAPI (blue) indicates the nuclei of cells in merged images. Arrows indicate OptoA1 cluster and SG puncta co-localization. Scale bars = 5 µm. (B) Quantification of the percent of transfected OptoA1 cells that contained both A1 clusters and G3BP1-positive SG. (C) Quantification of A1 cluster and G3BP1-positive SG co-localization. Data shown are mean ± S.E.M. for three biological replicates. Co-localization was performed using ImageJ Coloc2 assessed using Pearson’s correlation coefficients. One-way ANOVA, with a Tukey post hoc test, was performed to indicate significance between percent transfected cells with A1 clusters and SG puncta, and Pearson′s correlation coefficients. * p < 0.05; ** p < 0.01; **** p < 0.0001; NS = Not Significant.
Figure 5
Figure 5
SG formation dynamics are increased in cells expressing OptoA1(F281L) and OptoA1(P275S) mutants. Quantification of SG puncta formation and dissociation during a BL stimulation protocol. HEK293T cells expressing GFP-G3BP1 alone (AD; black curves), or co-expressing Opto-mCh (A; magenta), OptoA1WT (B; green), OptoA1(F281L) (C; red), or OptoA1(P275S) (D; blue) with GFP-G3BP1 were exposed to BL stimulation (10,000 lux, 465 nm) for 120 min. Results are plotted as a percent maximum to the highest SG puncta response at 120 min for each OptoA1 construct co-transfected with GFP-G3BP1, resulting in a kinetics curve for association dynamics. Dashed lines indicate KA1/2Max. Two-way ANOVA, with a Bonferroni post hoc test, was performed to indicate significance on kinetics curves. (Ai), (Bi), (Ci) and (Di) Quantification of percent cells with SG puncta over the time-course of a BL experimental paradigm. Two-way ANOVA, with a Bonferroni post hoc test, was performed to indicate significance on kinetics curves. (Aii), (Bii), (Cii) and (Dii) Representative images of 120-min BL stimulated, GFP-G3BP1 and Opto-mCh (A), OptoA1WT (B), OptoA1(F281L) (C), or OptoA1(P275S) (D) co-transfected cells. Arrows indicate OptoA1 cluster and SG puncta co-localization. * indicate cells with SG puncta formation without A1 co-localization. Scale bars = 5 µm. (E) Fold change quantification of SG puncta formation in cells with A1 clusters. One-way ANOVA, with a Tukey post hoc test, was performed to indicate significance between fold change SG puncta formation in OptoA1 cluster containing cells at peak stimulation (120 min). Data shown are mean ± S.E.M. for three biological replicates. * p < 0.05; ** p < 0.01; *** p < 0.001; **** p < 0.0001.

Similar articles

Cited by

References

    1. Lassmann H., van Horssen J. The molecular basis of neurodegeneration in multiple sclerosis. FEBS Lett. 2011;585:3715–3723. doi: 10.1016/j.febslet.2011.08.004. - DOI - PubMed
    1. Dutta R., McDonough J., Yin X., Peterson J., Chang A., Torres T., Gudz T., Macklin W.B., Lewis D.A., Fox R.J. Mitochondrial dysfunction as a cause of axonal degenerationin multiple sclerosis patients. Ann. Neurol. 2006;59:478–489. doi: 10.1002/ana.20736. - DOI - PubMed
    1. De Vos K.J., Grierson A.J., Ackerley S., Miller C.C.J. Role of axonal transport in neurodegenerative diseases. Annu. Rev. Neurosci. 2008;31:151–173. doi: 10.1146/annurev.neuro.31.061307.090711. - DOI - PubMed
    1. Campbell G.R., Ziabreva I., Reeve A.K., Krishnan K.J., Reynolds R., Howell O., Lassmann H., Turnbull D.M., Mahad D.J. Mitochondrial DNA deletions and neurodegeneration in multiple sclerosis. Ann. Neurol. 2010;69:481–492. doi: 10.1002/ana.22109. - DOI - PMC - PubMed
    1. Haider L., Fischer M.T., Frischer J.M., Bauer J., Höftberger R., Botond G., Esterbauer H., Binder C.J., Witztum J.L., Lassmann H. Oxidative damage in multiple sclerosis lesions. Brain. 2011;134:1914–1924. doi: 10.1093/brain/awr128. - DOI - PMC - PubMed

MeSH terms

Substances