. 2021 Mar 16;13(6):1335.
doi: 10.3390/cancers13061335.

Immune-Stimulatory Effects of Curcumin on the Tumor Microenvironment in Head and Neck Squamous Cell Carcinoma

Affiliations

Immune-Stimulatory Effects of Curcumin on the Tumor Microenvironment in Head and Neck Squamous Cell Carcinoma

Charlotte Kötting et al. Cancers (Basel). .

Abstract

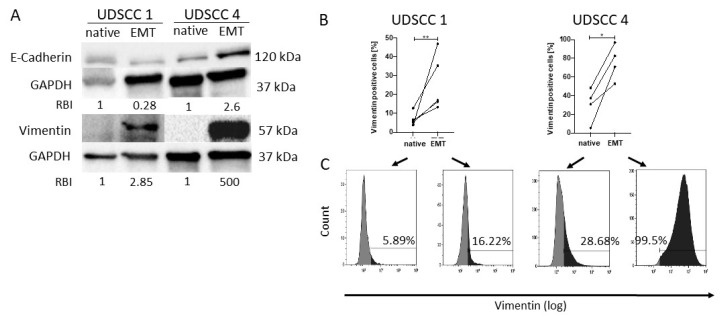
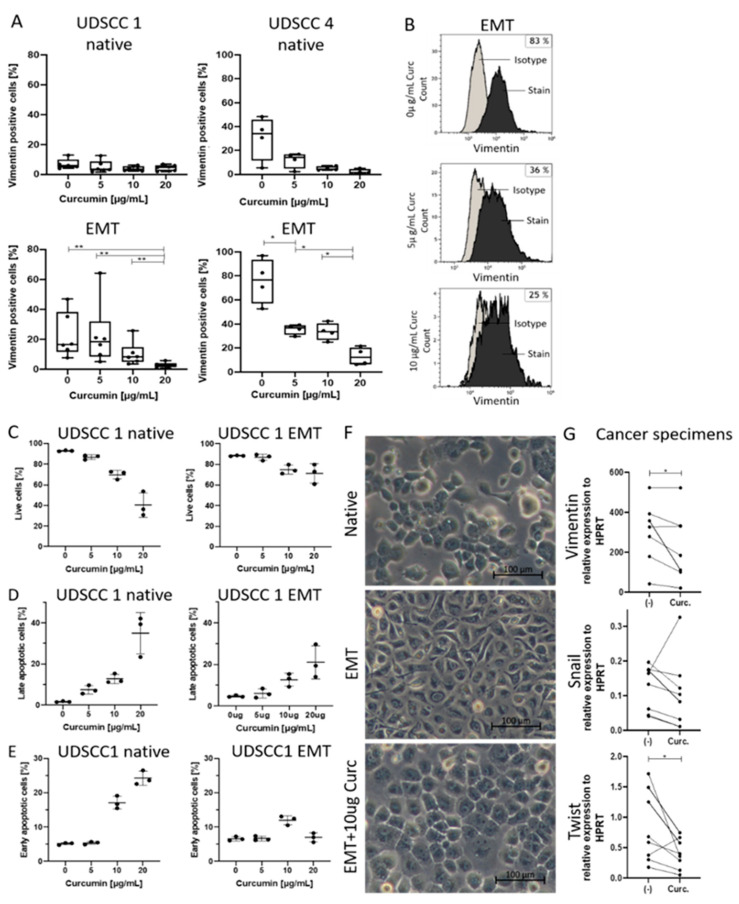
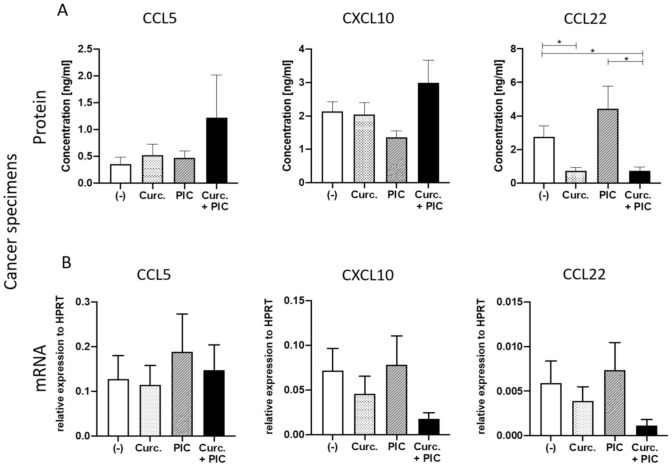
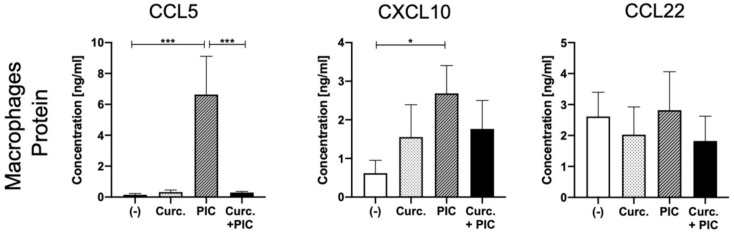
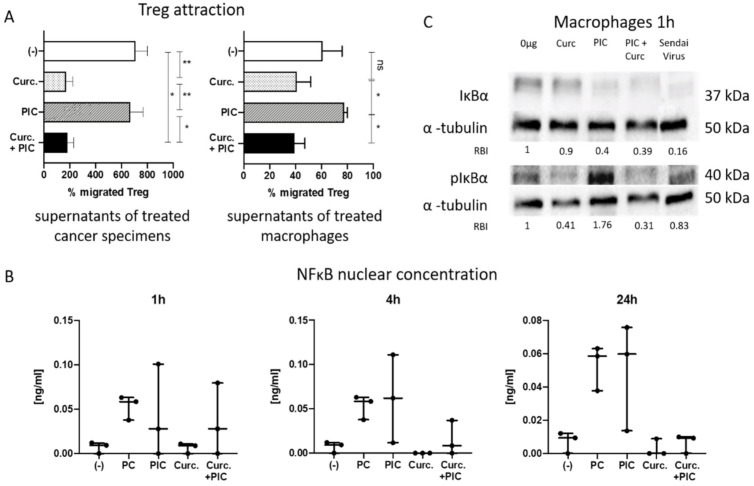
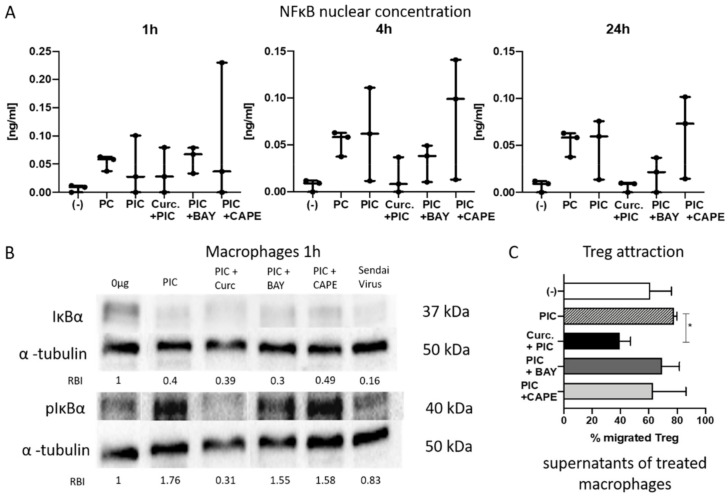
Curcumin is known to have immune-modulatory and antitumor effects by interacting with more than 30 different proteins. An important feature of curcumin is the inhibition of nuclear factor kappa of activated B-cells (NF-κB). Here, we evaluate the potential of curcumin to reverse the epithelial to mesenchymal transition (EMT) of head and neck squamous cell carcinoma (HNSCC) cells as a part of tumor escape mechanisms. We examined the impact of curcumin on the expression of different pro- and antitumoral chemokines in ex vivo HNSCC tumor tissue and primary macrophage cultures. Further, we evaluated the combinatorial effect of curcumin and toll-like receptor 3 (TLR3) agonist Poly I:C (PIC) on NF-κB inhibition and regulatory T-cell (Treg) attraction. Mesenchymal markers were significantly reduced in cancer specimens after incubation with curcumin, with simultaneous reduction of key transcription factors of EMT, Snail, and Twist. Furthermore, a decrease of the Treg-attracting chemokine CCL22 was observed. Additionally, curcumin-related inhibition of NF-κB nuclear translocation was evident. The combination of PIC with curcumin resulted in further NF-κB inhibition, whereas PIC alone contrarily resulted in NF-κB activation. Furthermore, curcumin was more effective in inhibiting PIC-dependent NF-κB activation and Treg attraction compared to known NF-κB inhibitors BAY 11-7082 or caffeic acid phenethyl ester (CAPE). The presented results show, for the first time, the immune-modulating effects of curcumin in HNSCC, with potent inhibition of the Treg-attracting effects of PIC. Hence, curcumin presents a promising drug in cancer therapy as a supplement to already established treatments.

Keywords: NF-κB; NF-κB inhibitors; Poly I:C; curcumin; epithelial to mesenchymal transition; head and neck squamous cell carcinoma; modulation of tumor microenvironment.


Conflict of interest statement

The authors declare no conflict of interest. The funders had no role in the design of the study; in the collection, analyses, or interpretation of data; in the writing of the manuscript, or in the decision to publish the results.

Figures

Figure 1
Figure 1
Confirmation of epithelial to mesenchymal transition (EMT) induction. UDSCC1 and UDSCC4 cells were treated with StemXVivo EMT-inducing media supplement for 5 days to induce EMT. (A) Western blots were performed for detection of E-cadherin and vimentin expression of native and EMT-induced UDSCC1 and UDSCC4 cell lines. Note the increased expression of vimentin in both cell lines after EMT induction, while E-cadherin expression was increased in UDSCC4 cells but decreased in UDSCC1 cells. Relative band intensities (RBIs) were calculated between E-cadherin and GAPDH or vimentin and GAPDH. The blot is representative for n = 3. Original blots can be found in Figure S1. (B) Flow cytometry of native and EMT-induced cells revealed significantly higher vimentin levels in EMT cells. P-values were determined with the Mann–Whitney test, with * p < 0.05, ** p < 0.01. (C) Representative flow cytometry histograms depicting vimentin expression of native and EMT-induced UDSCC1 and UDSCC4 cell lines. Note that Vimentin expression was increased after treatment with StemXVivo EMT-inducing media supplement, especially for UDSCC4.
Figure 2
Figure 2
(AE) Native and EMT-induced UDSCC1 or UDSCC4 cells were treated with indicated concentrations of curcumin (0, 5, 10, or 20 µg/mL) for 48 h. Then, vimentin expression was analyzed by flow cytometry (A,B), and apoptosis was assessed by annexin/propidium iodide (PI) assay (CE). (A) EMT-induced cell lines showed significantly decreased vimentin expression with increased concentrations of curcumin; n = 4 (UDSCC4 EMT), n = 6 (UDSCC1 EMT and UDSCC4 native), n = 7 (UDSCC1). Bars represent minimum to maximum, with a line at the mean. (B) Representative flow cytometry histograms depicting vimentin expression of EMT-induced UDSCC4 cells after incubation with curcumin. (C) The amount of live UDSCC1 cells was especially reduced for native cells with increased concentrations of curcumin. (D) Late UDSCC1 apoptotic cells were detected for native cells with 20 µg/mL curcumin; effects on EMT-induced cells were less prominent. (E) The number of early apoptotic cells was higher with increased curcumin concentrations, especially with 20 µg/mL. Effects were more pronounced for native cells. n = 3. Bars represent minimum to maximum with a line at the median. (F) Native UDSCC cells showed typical epithelial characteristics such as rounded cell bodies (top), while EMT-induced cells showed mesenchymal remodeling with its signifying protrusions (middle). We observed that EMT-induced cells incubated with 10 µg/mL curcumin (Curc.) were able to convert mesenchymal characteristics into epithelial ones (bottom). (G) Evaluation of mesenchymal markers (Vim/Snail/Twist) in cancer specimens by qRT-PCR after incubation with the negative control (-) or 10 µg/mL curcumin (Curc.) for 24 h. mRNA levels are shown as relative expression to the normalization control HPRT. n = 9, each dot represents an individual tumor sample. P-values in (A) and (G) were determined with the Mann–Whitney test, with * p < 0.05, ** p < 0.01.
Figure 3
Figure 3
Chemokine expression in ex vivo tumor tissues. (A) Detection of chemokines CCL5, CXCL10, and CCL22 in supernatants of cancer specimens after incubation with the negative control (-), 10 µg/mL curcumin (Curc.) and/or PIC for 24 h. Results were determined via ELISA. n = 5. (B) Evaluation of chemokine expression (CCL5/CXCL10/CCL22 in cancer specimens by qRT-PCR after incubation with the negative control (-), curcumin (Curc.) and/or PIC for 24 h. mRNA levels are shown as relative expression to the normalization control HPRT. n = 9. Bars represent mean with standard error of mean (SEM). P-values were determined with the Mann–Whitney test, with * p < 0.05.
Figure 4
Figure 4
Chemokine expression in macrophage cultures. Detection of chemokines CCL5, CXCL10, and CCL22 from supernatants of macrophage cultures after incubation with the negative control (-), 10 µg/mL curcumin (Curc.) and/or PIC for 24 h. Results were determined via ELISA. n = 7. Bars represent mean with SEM. P-values were determined with the Mann–Whitney test, with * p < 0.05, *** p < 0.001.
Figure 5
Figure 5
(A) Regulatory T-cell (Treg) attraction. Cancer specimens and macrophages were incubated with adjuvants for 24 h. After incubation, supernatants were harvested, and a migration assay was performed for 1.5 h. Flow cytometry was used to count the migrated cells. A decreased amount of migrated Treg can be seen after 10 µg/mL curcumin (Curc.) or 10 µg/mL curcumin + PIC incubation, especially for supernatants of the cancer specimens. (-) indicates the negative control. n = 5. Bars represent mean with SEM. P-values were determined with the Mann–Whitney test, with * p < 0.05, ** p < 0.01; ns = not significant. (B) Nuclear concentration of NFκB in macrophages after incubation with adjuvants for 1, 4, and 24 h. Note the increased NFκB nuclear concentration in samples treated with the positive control (PC) or PIC in contrast to almost no activation with curcumin (Curc., 10 µg/mL). Treatment with curcumin and PIC shows a clear decrease of NFκB nuclear concentration after 4 and 24 h of incubation. (-) indicates the negative control. Results were determined via ELISA. n = 3. Bars represent minimum to maximum with a line at the mean. (C) Western blot for IκBα, pIκBα and α–tubulin after 1 h of macrophage treatment as indirect evidence for nuclear translocation of NFκB, showing a decreased expression of IκBα after incubation with PIC and an increased amount of pIκBα as a marker of NFκB nuclear translocation. Although treatment with PIC and curcumin shows only a slight increase in IκBα compared to PIC alone, a decreased expression of activated IκBα (pIκBα) is clearly visible. Relative band intensities (RBIs) were calculated between IĸBα and α-tubulin or pIĸBα and α-tubulin. The blot is representative for n = 3. Original blots can be found in Figure S1. The α-tubulin loading controls for IĸBα and pIĸBα shown in (C) are identical to the α-tubulin loading controls shown in Figure 6B since they are part of the same original blots; the figures are organized as shown to better align with the data persented in the results section.
Figure 6
Figure 6
(A) Nuclear concentration of NF-κB in macrophages after incubation with adjuvants for 1, 4, and 24 h. Concentrations were determined by ELISA. Note that treatment with curcumin (Curc.) and PIC shows after 4 h less activation than the treatments with PIC and BAY or PIC and CAPE. (-) indicates the negative control. n = 3. Bars represent minimum to maximum with a line at the mean. (B) Western blot for IκBα, pIκBα, and α-tubulin after 1 h of macrophage treatment as indirect evidence for activated or inactivated NFκB. Relative band intensities (RBIs) were calculated between IĸBα and α-tubulin or pIĸBα and α-tubulin. The blot is representative for n = 3. Original blots can be found in Figure S1. (C) Treg attraction. Cancer specimens and macrophages were incubated with adjuvants for 24 h. After incubation, supernatants were harvested, and a migration assay was performed for 1.5 h. Flow cytometry was used to count migrated cells. n = 3 (PIC + BAY, PIC + CAPE), n = 4 ((-), PIC, Curc. + PIC). Bars represent mean with SEM. P-values were determined with the Mann–Whitney test, with * p < 0.05. The α-tubulin loading controls for IĸBα and pIĸBα shown in (B) are identical to the α-tubulin loading controls shown in Figure 5C since they are part of the same original blots; the figures are organized as shown to better align with the data persented in the results section.

Similar articles

Cited by

References

    1. Stewart B.W., Wild C.P. World Cancer Report 2014. International Agency for Research on Cancer; Lyon, France: 2014. IARC Publications Website-World Cancer Report 2014.
    1. Bray F., Ferlay J., Soerjomataram I., Siegel R.L., Torre L.A., Jemal A. Global Cancer Statistics 2018: GLOBOCAN Estimates of Incidence and Mortality Worldwide for 36 Cancers in 185 Countries. CA: Cancer J. Clin. 2018;68:394–424. doi: 10.3322/caac.21492. - DOI - PubMed
    1. Whiteside T.L. Head and Neck Carcinoma Immunotherapy: Facts and Hopes. Clin. Cancer Res. 2017;24:6–13. doi: 10.1158/1078-0432.CCR-17-1261. - DOI - PMC - PubMed
    1. Cooper J.S., Pajak T.F., Forastiere A.A., Jacobs J., Campbell B.H., Saxman S.B., Kish J.A., Kim H.E., Cmelak A.J., Rotman M., et al. Postoperative Concurrent Radiotherapy and Chemotherapy for High-Risk Squamous-Cell Carcinoma of the Head and Neck. N. Engl. J. Med. 2004;350:1937–1944. doi: 10.1056/NEJMoa032646. - DOI - PubMed
    1. Ang K.K., Zhang Q., Rosenthal D.I., Nguyen-Tan P.F., Sherman E.J., Weber R.S., Galvin J.M., Bonner J.A., Harris J., El-Naggar A.K., et al. Randomized Phase III Trial of Concurrent Accelerated Radiation Plus Cisplatin with or Without Cetuximab for Stage III to IV Head and Neck Carcinoma: RTOG 0522. J. Clin. Oncol. 2014;32:2940–2950. doi: 10.1200/JCO.2013.53.5633. - DOI - PMC - PubMed

LinkOut - more resources