. 2021 Mar 16;11(3):838.
doi: 10.3390/ani11030838.

Diet Transition from High-Forage to High-Concentrate Alters Rumen Bacterial Community Composition, Epithelial Transcriptomes and Ruminal Fermentation Parameters in Dairy Cows

Affiliations

Diet Transition from High-Forage to High-Concentrate Alters Rumen Bacterial Community Composition, Epithelial Transcriptomes and Ruminal Fermentation Parameters in Dairy Cows

Sonny C Ramos et al. Animals (Basel). .

Abstract

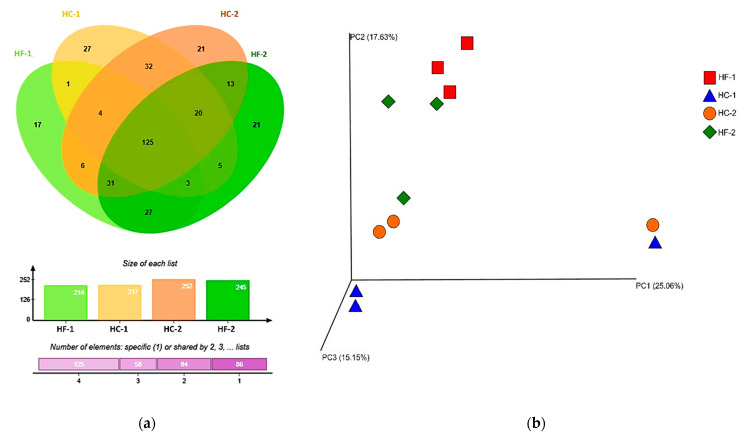
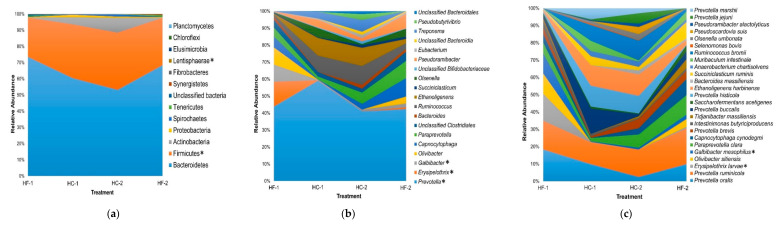
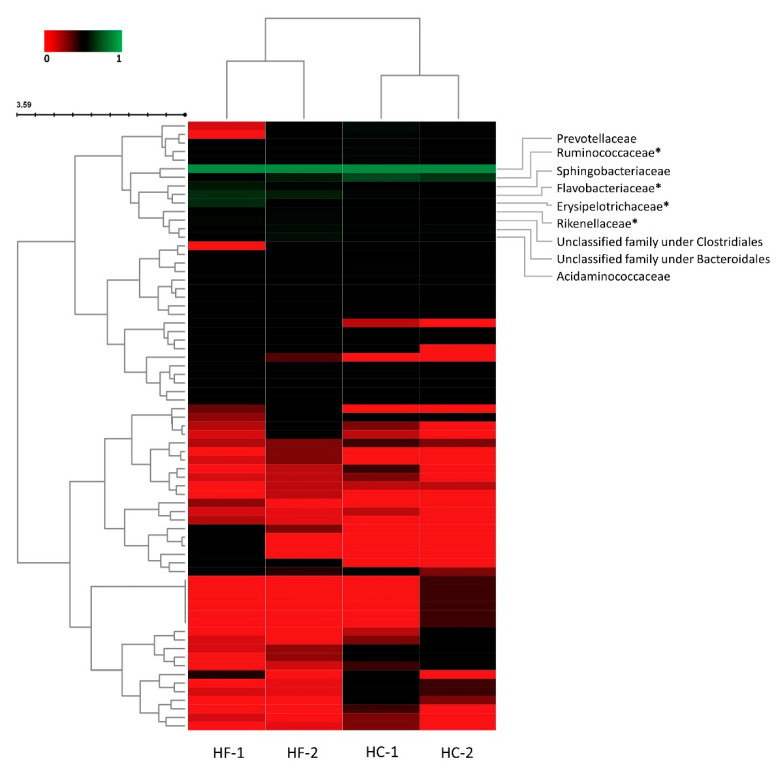
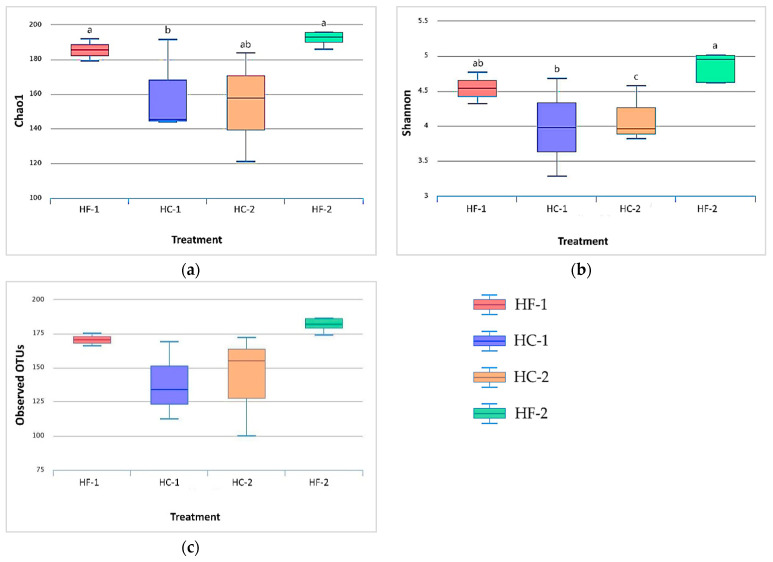
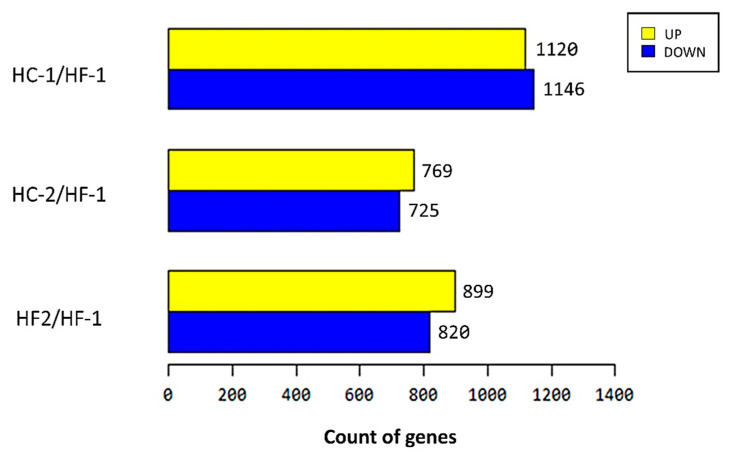
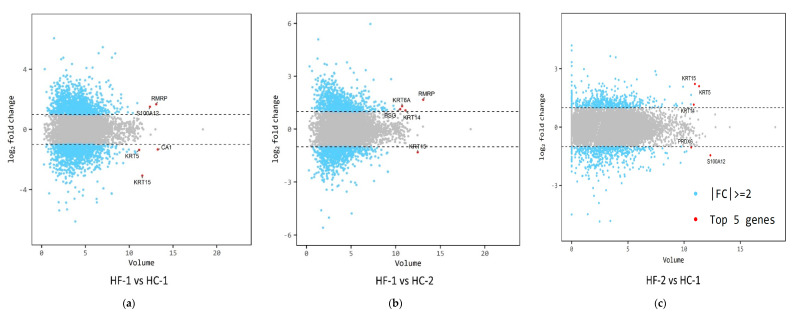
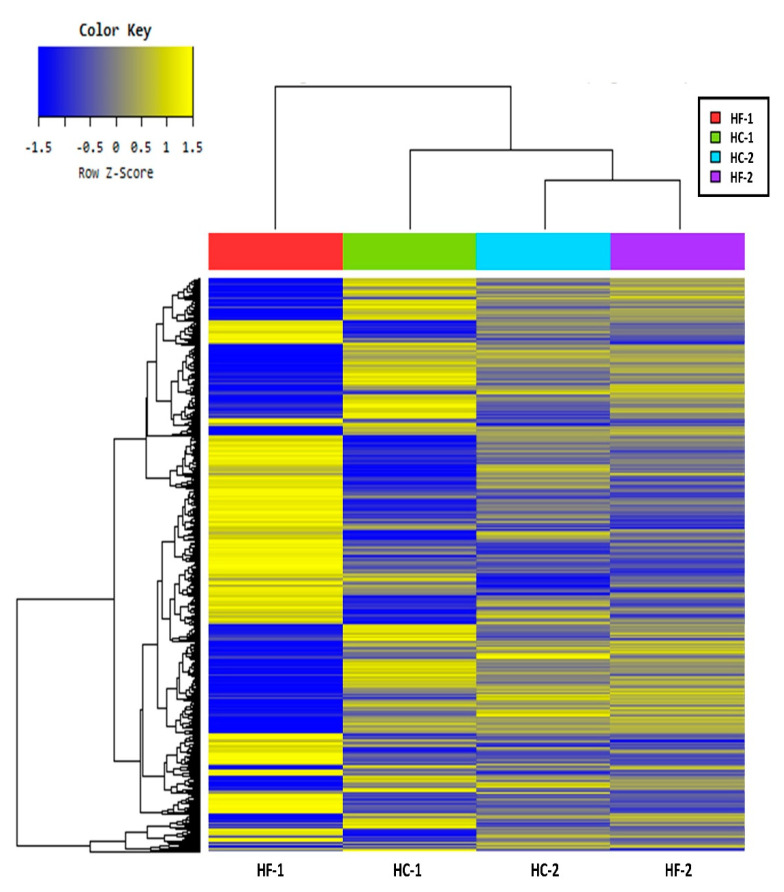
Effects of changing diet on rumen fermentation parameters, bacterial community composition, and transcriptome profiles were determined in three rumen-cannulated Holstein Friesian cows using a 3 × 4 cross-over design. Treatments include HF-1 (first high-forage diet), HC-1 (first high-concentrate diet), HC-2 (succeeding high-concentrate diet), and HF-2 (second high-forage diet as a recovery period). Animal diets contained Klein grass and concentrate at ratios of 8:2, 2:8, 2:8, and 8:2 (two weeks each), respectively. Ammonia-nitrogen and individual and total volatile fatty acid concentrations were increased significantly during HC-1 and HC-2. Rumen species richness significantly increased for HF-1 and HF-2. Bacteroidetes were dominant for all treatments, while phylum Firmicutes significantly increased during the HC period. Prevotella, Erysipelothrix, and Galbibacter significantly differed between HF and HC diet periods. Ruminococcus abundance was lower during HF feeding and tended to increase during successive HC feeding periods. Prevotellaruminicola was the predominant species for all diets. The RNA sequence analysis revealed the keratin gene as differentially expressed during the HF diet, while carbonic-anhydrase I and S100 calcium-binding protein were expressed in the HC diet. Most of these genes were highly expressed for HC-1 and HC-2. These results suggested that ruminal bacterial community composition, transcriptome profile, and rumen fermentation characteristics were altered by the diet transitions in dairy cows.

Keywords: bacterial community; changing diet; dairy cows; rumen fermentation; transcriptome.


Conflict of interest statement

The authors declare no conflict of interest.

Figures

Figure 1
Figure 1
Venn diagram of rumen microbiome after transition of diet from high forage (HF-1) to high concentrate (HC-1 to HC-2), and back to high forage (HF-2), representing the unique, shared, and core microbiome. The bar graph below shows the size of representative species of observed operational taxonomic units (OTUs) per treatment. (a) Venn diagram was generated using jVenn [47]. (b) Principal coordinate analysis (PCoA) of all samples using Bray-Curtis distance derived from the subset of identified OTUs. EMPeror [48] was used to generate the PCoA plot. HF-1, high-forage diet; HC-1, high-concentrate diet; HC-2, high-concentrate diet; HF-2, high-forage diet.
Figure 2
Figure 2
Relative abundance of the observed (a) phyla, (b) genera, and (c) species from the four different treatments. Relative abundance was computed using Quantitative Insights Into Microbial Ecology (QIIME) [39]. HF-1, high-forage diet; HC-1, high-concentrate diet; HC-2, high-concentrate diet; HF-2, high-forage diet. Asterisk (*) denotes significant differences (p < 0.05).
Figure 3
Figure 3
Heatmap clustering of observed families (rows) based on normalized value (0–1) of relative abundance per treatment (columns) using Bray-Curtis dissimilarity test and Ward linkage. Figure generated using Interactive Cluster Heatmap library (InCHlib) [49]. HF-1, high-forage diet; HC-1, high-concentrate diet; HC-2, high-concentrate diet; HF-2, high-forage diet. Asterisk (*) denotes significant differences (p < 0.05).
Figure 4
Figure 4
Boxplot representation of alpha diversity indices: (a) chao1, (b) Shannon, and (c) observed OTUs, between diet groups. Alpha-diversity metrics’ visualization were done in MetaCOMET [40] and computed using QIIME [39]. HF-1, high-forage diet; HC-1, high-concentrate diet; HC-2, high-concentrate diet; HF-2, high-forage diet. a–c superscript denotes significant differences (p < 0.05).
Figure 5
Figure 5
The differentially expressed genes’ (DEGs) up- and down-regulated count among HF-1 (control), HC-1, HC-2, and HF-2 groups. The Y-axis represents up- and down-regulation of DEGs between control vs. treatment groups. The X-axis represents the total number of transcripts (DEGs for each pairwise comparison was selected at FC > = 2). HF-1, high-forage diet (served as control group); HC-1, high-concentrate diet; HC-2, high-concentrate diet; HF-2, high-forage diet.
Figure 6
Figure 6
Gene expression volume plot between treatment groups. Genes that showed higher expression difference between HF-1 (control group) and HC-1 (treated group) (a). Genes that showed higher expression difference between HF-1 (control group) and HC-2 (treated group) (b). HF-2 (control group) and HC-1 (treated group) (c). RMRP, RNA component of mitochondrial RNA processing endoribonuclease; S100A12, S100 calcium binding protein A12; CA1, carbonic anhydrase I; KRT5, keratin 5; KRT6A, keratin 6A; KRT14, keratin 14; KRT15, keratin 15; BSG, basigin; PRDX6, peroxiredoxin 6. Red dot: top 5 genes by volume which satisfies, |fc| ≥ 2. FC, fold-change.
Figure 7
Figure 7
Hierarchical clustering analysis by Euclidean distance and complete linkage showing the similarity of genes and treatments based on normalized value of expression level from the significant list. HF-1, high-forage diet; HC-1, high-concentrate diet; HC-2, high-concentrate diet; HF-2, high-forage diet.

References

    1. Wetzels S., Mann E., Pourazad P., Qumar M., Pinior B., Metzler-Zebeli B., Wagner M., Schmitz-Esser S., Zebeli Q. Epimural bacterial community structure in the rumen of Holstein cows with different responses to a long-term subacute ruminal acidosis diet challenge. J. Dairy Sci. 2017;100:1829–1844. doi: 10.3168/jds.2016-11620. - DOI - PubMed
    1. Nagata R., Kim Y.-H., Ohkubo A., Kushibiki S., Ichijo T., Sato S. Effects of repeated subacute ruminal acidosis challenges on the adaptation of the rumen bacterial community in Holstein bulls. J. Dairy Sci. 2018;101:4424–4436. doi: 10.3168/jds.2017-13859. - DOI - PubMed
    1. Zebeli Q., Aschenbach J., Tafaj M., Boguhn J., Ametaj B., Drochner W. Invited review: Role of physically effective fiber and estimation of dietary fiber adequacy in high-producing dairy cattle. J. Dairy Sci. 2012;95:1041–1056. doi: 10.3168/jds.2011-4421. - DOI - PubMed
    1. Boerman J., Potts S., VandeHaar M., Allen M., Lock A. Milk production responses to a change in dietary starch concentration vary by production level in dairy cattle. J. Dairy Sci. 2015;98:4698–4706. doi: 10.3168/jds.2014-8999. - DOI - PubMed
    1. Kleen J., Cannizzo C. Incidence, prevalence and impact of SARA in dairy herds. Anim. Feed Sci. Technol. 2012;172:4–8. doi: 10.1016/j.anifeedsci.2011.12.003. - DOI

LinkOut - more resources