

Genome-Wide Association Study Reveals Marker-Trait Associations for Early Vegetative Stage Salinity Tolerance in Rice
- PMID: 33809618
- PMCID: PMC8000697
- DOI: 10.3390/plants10030559
Genome-Wide Association Study Reveals Marker-Trait Associations for Early Vegetative Stage Salinity Tolerance in Rice
Abstract
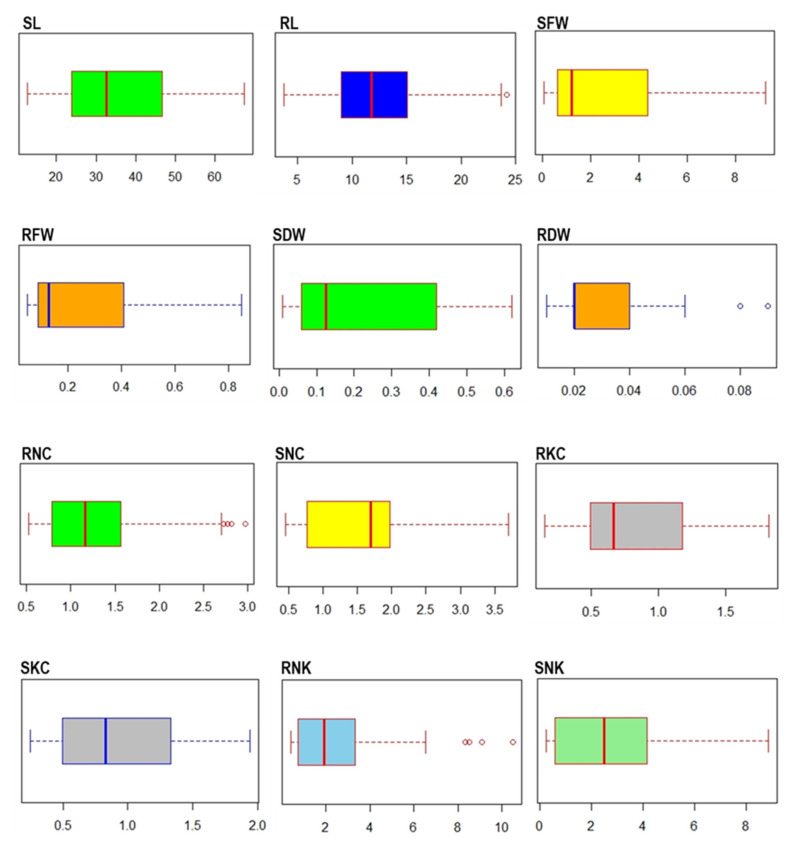
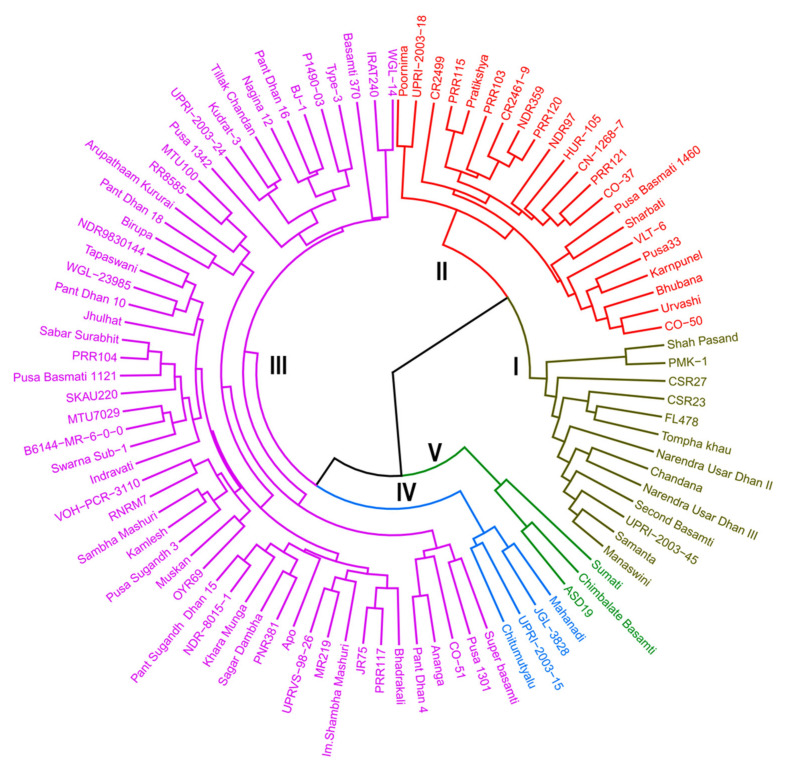
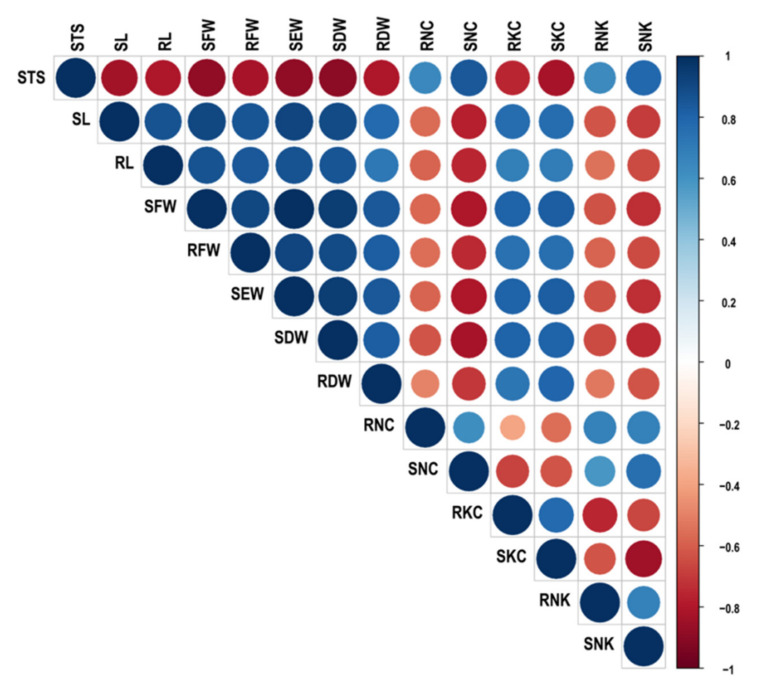
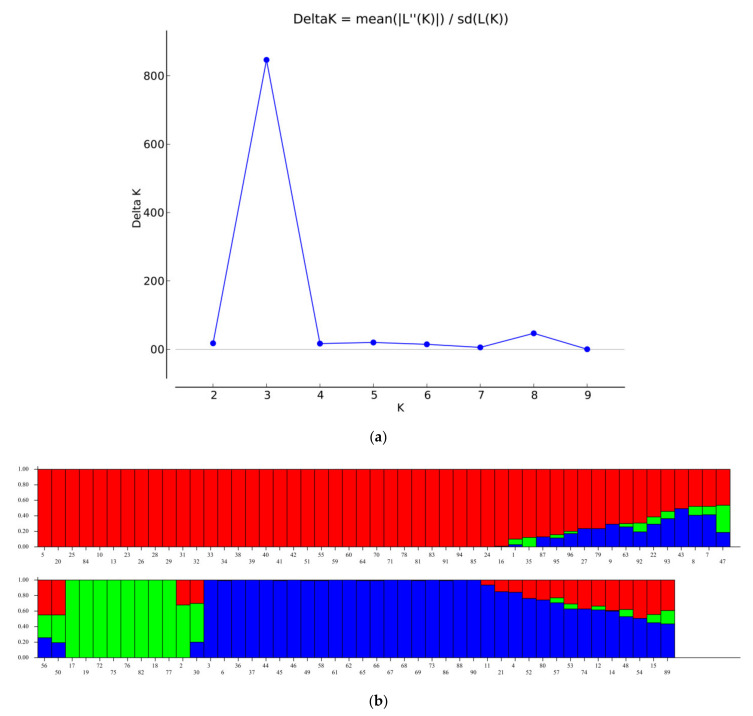
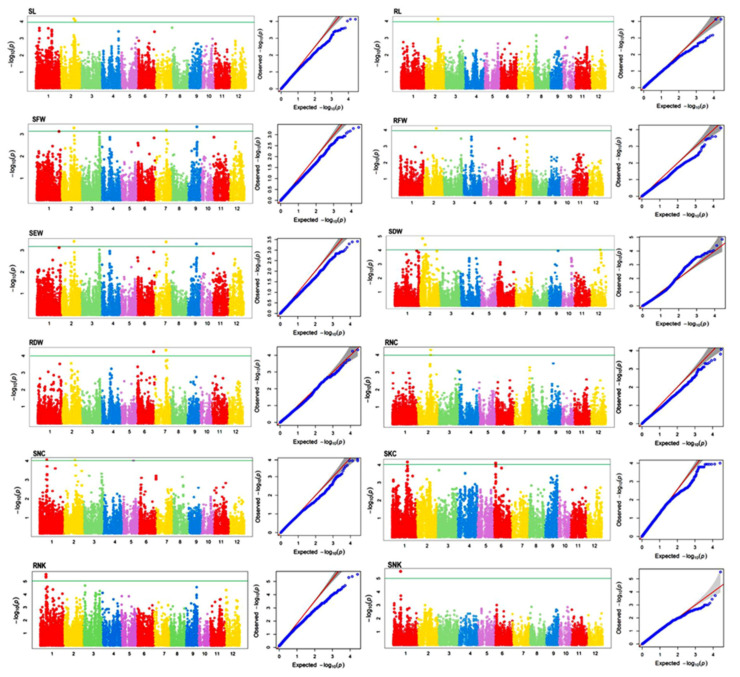
Rice germplasm is a rich resource for discovering genes associated with salt tolerance. In the current study, a set of 96 accessions were evaluated for seedling stage salinity tolerance and its component traits. Significant phenotypic variation was observed among the genotypes for all the measured traits and eleven accessions with high level of salt tolerance at seedling stage were identified. The germplasm set comprised of three sub-populations and genome-wide association study (GWAS) identified a total of 23 marker-trait associations (MTAs) for traits studied. These MTAs were located on rice chromosomes 1, 2, 5, 6, 7, 9, and 12 and explained the trait phenotypic variances ranging from 13.98 to 29.88 %. Twenty-one MTAs identified in this study were located either in or near the previously reported quantitative trait loci (QTLs), while two MTAs namely, qSDW2.1 and qSNC5 were novel. A total of 18 and 13 putative annotated candidate genes were identified in a genomic region spanning ~200 kb around the MTAs qSDW2.1 and qSNC5, respectively. Some of the important genes underlying the novel MTAs were OsFBA1,OsFBL7, and mTERF which are known to be associated with salinity tolerance in crops. These MTAs pave way for combining salinity tolerance with high yield in rice genotypes through molecular breeding.
Keywords: GWAS; MTAs; SNP; rice; salinity tolerance; salt stress.
Conflict of interest statement
The authors declare that the research was conducted in the absence of any commercial or financial relationships that could be construed as a potential conflict of interest. The funders had no role in the design of the study; in the collection, analyses, or interpretation of data; in the writing of the manuscript, or in the decision to publish the results.
Figures
References
-
- FAOSTAT . FAO Rice Market Monitor. Food and Agriculture Organization of the United Nations; Rome, Italy: 2017.
-
- Turral H., Burke J., Faurès J.M. Climate Change, Water and Food Security. Food and Agriculture Organization of the United Nations (FAO); Rome, Italy: 2011. p. 36.
-
- Bouman B.A., Barker R., Humphreys E., Tuong T.P., Atlin G., Bennett J., Dawe D., Dittert K., Dobermann A., Facon T., et al. Water for Food, Water for Life: A Comprehensive Assessment of Water Management in Agriculture. IWMI; Colombo, Sri Lanka: 2007. [(accessed on 12 February 2021)]. Rice: Feeding the Billions; pp. 515–549. Available online: https://cgspace.cgiar.org/handle/10568/17345.
-
- Provin T., Pitt J.L. Managing Soil Salinity. [(accessed on 12 February 2021)];2001 Texas FARMER Collection. Available online: https://oaktrust.library.tamu.edu/bitstream/handle/1969.1/86985/pdf_1397....
LinkOut - more resources
Full Text Sources
Other Literature Sources
