Comparative Study
. 2021 Mar 16;22(6):3031.
doi: 10.3390/ijms22063031.

Vandetanib versus Cabozantinib in Medullary Thyroid Carcinoma: A Focus on Anti-Angiogenic Effects in Zebrafish Model

Affiliations
Comparative Study

Vandetanib versus Cabozantinib in Medullary Thyroid Carcinoma: A Focus on Anti-Angiogenic Effects in Zebrafish Model

Silvia Carra et al. Int J Mol Sci. .

Abstract

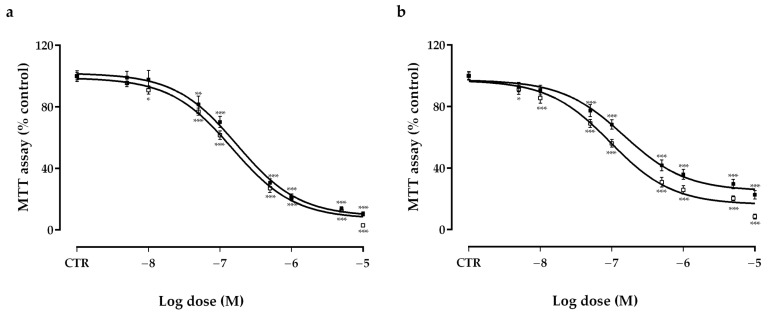
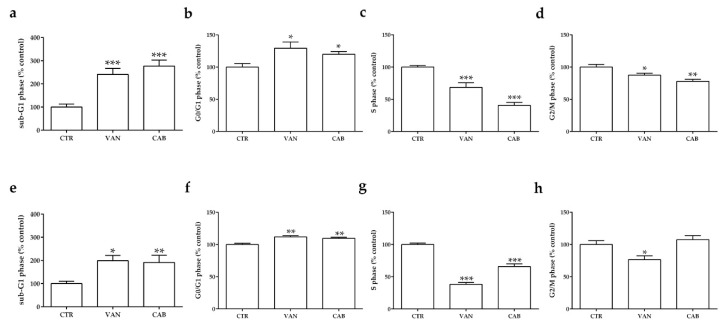
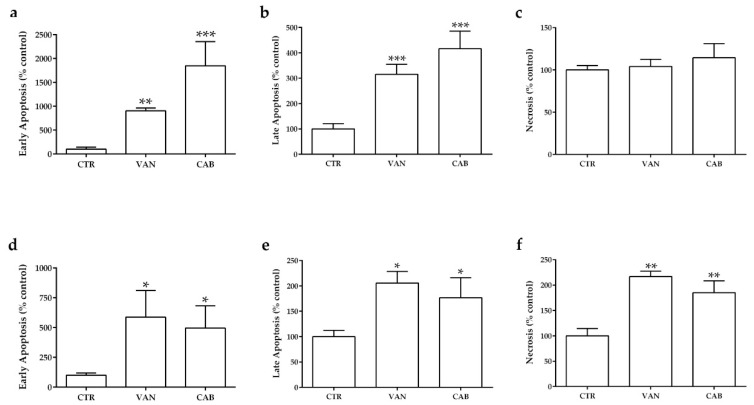
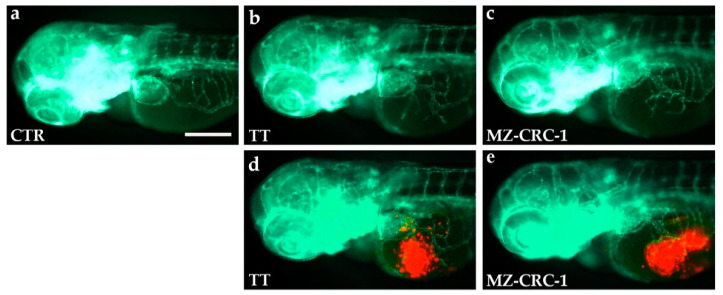
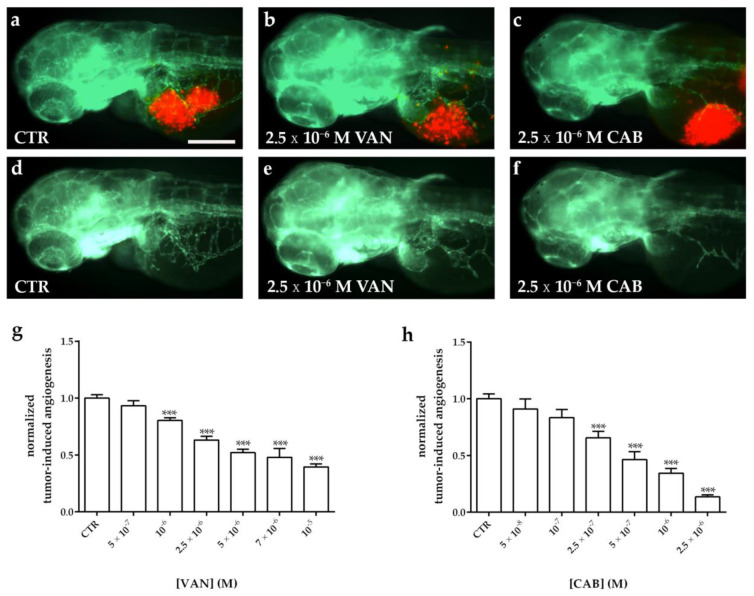
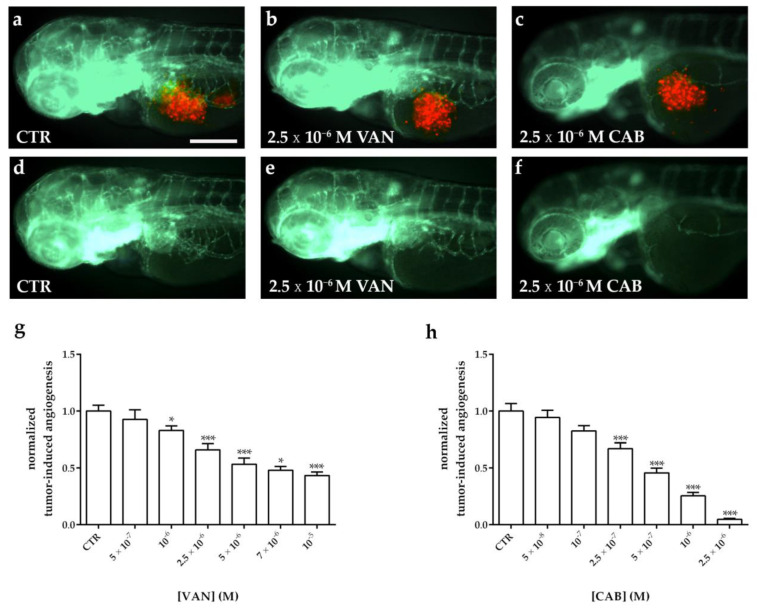
Medullary thyroid carcinoma (MTC) is a tumor deriving from the thyroid C cells. Vandetanib (VAN) and cabozantinib (CAB) are two tyrosine kinase inhibitors targeting REarranged during Transfection (RET) and other kinase receptors and are approved for the treatment of advanced MTC. We aim to compare the in vitro and in vivo anti-tumor activity of VAN and CAB in MTC. The effects of VAN and CAB on viability, cell cycle, and apoptosis of TT and MZ-CRC-1 cells are evaluated in vitro using an MTT assay, DNA flow cytometry with propidium iodide, and Annexin V-FITC/propidium iodide staining, respectively. In vivo, the anti-angiogenic potential of VAN and CAB is evaluated in Tg(fli1a:EGFP)y1 transgenic fluorescent zebrafish embryos by analyzing the effects on the physiological development of the sub-intestinal vein plexus and the tumor-induced angiogenesis after TT and MZ-CRC-1 xenotransplantation. VAN and CAB exert comparable effects on TT and MZ-CRC-1 viability inhibition and cell cycle perturbation, and stimulated apoptosis with a prominent effect by VAN in MZ-CRC-1 and CAB in TT cells. Regarding zebrafish, both drugs inhibit angiogenesis in a dose-dependent manner, in particular CAB shows a more potent anti-angiogenic activity than VAN. To conclude, although VAN and CAB show comparable antiproliferative effects in MTC, the anti-angiogenic activity of CAB appears to be more relevant.

Keywords: angiogenesis; cabozantinib; medullary thyroid carcinoma (MTC); tumor xenograft; tyrosine kinase inhibitors (TKIs); vandetanib; zebrafish.


Conflict of interest statement

The authors declare no conflict of interest. The funders had no role in the design of the study; in the collection, analyses, or interpretation of data; in the writing of the manuscript, or in the decision to publish the results.

Figures

Figure 1
Figure 1
Effects of vandetanib (VAN) (□) and cabozantinib (CAB) (■) on cell viability in TT (a) and MZ-CRC-1 (b) cell lines measured using an MTT assay. Cells were incubated for six days with vehicle (control), or with the drug at different concentrations, as described in the Material and Methods. Dose response curves were expressed as a nonlinear regression (curve fit) of log (concentration drug) versus the percentage of the control. Values represent the mean ± S.E.M. of at least three independent experiments in six replicates. Control (CTR) values have been set to 100%. * p < 0.05; ** p < 0.01; *** p < 0.001.
Figure 2
Figure 2
Effects of vandetanib (VAN) and cabozantinib (CAB) on the cell cycle in medullary thyroid carcinoma (MTC) cell lines. Cell cycle analysis after six days of incubation with VAN and CAB in TT (ad) and MZ-CRC-1 cell lines (eh). Cells were detected using FACS analysis after staining with propidium iodide. Control (CTR) values have been set to 100%. Cell cycle distribution is expressed as the percentage of cells in the G0/G1, S, and G2/M phases compared to the untreated CTR. Values represent the mean ± S.E.M. of at least three independent experiments. * p < 0.05; ** p < 0.01; *** p < 0.001.
Figure 3
Figure 3
Effects of vandetanib (VAN) and cabozantinib (CAB) on apoptosis in medullary thyroid carcinoma (MTC) cell lines. Cell death analysis after six days of incubation with VAN and CAB in TT (ac) and MZ-CRC-1 cell lines (df) through flow cytometry with Annexin V and propidium iodine. The proportions of cells in early apoptosis (a,d), late apoptosis (b,e) and necrosis (c,f) were expressed as the percentage compared with the untreated control (CTR) and represent the mean ± S.E.M. of at least three independent experiments. * p < 0.05; ** p < 0.01; *** p < 0.001.
Figure 4
Figure 4
Anti-angiogenic effect of vandetanib (VAN) and cabozantinib (CAB) on the physiological development of the zebrafish sub-intestinal vein (SIV) plexus. Representative fluorescence images of the SIV basket of 72 hpf Tg(fli1a:EGFP)y1 zebrafish embryos treated for 24 h with dimethyl sulfoxide (DMSO) (a), 5 × 10⁻⁶ M VAN (b) and CAB (c). Following 24 h of VAN (d) and CAB (e) treatments at different concentrations, the number of vertical vessels comprising the SIV basket was counted and compared with that of the control (CTR) embryos. Graphed values represent the mean ± S.E.M. *** p < 0.001 versus the CTR. Embryos are shown anterior to the left.
Figure 5
Figure 5
TT and MZ-CRC-1 implanted cells stimulate angiogenesis in zebrafish embryos after only 24 h post-injection. Representative fluorescence images of 72 hpf Tg(fli1a:EGFP)y1 zebrafish control embryos (a) and embryos implanted at 48 hpf with TT (b,d) and MZ-CRC-1 cells (c,e). The red channel, corresponding to TT or MZ-CRC-1 cells, was omitted in panels b and c to highlight the tumor-induced microvascular network. Compared to the control, grafted embryos showed vessels in green that sprout from the sub-intestinal vein (SIV) toward the xenograft of both cell lines. Embryos are shown anterior to the left. Scale bar: 100 µm.
Figure 6
Figure 6
Effect of vandetanib (VAN) and cabozantinib (CAB) treatments on tumor-induced angiogenesis after TT cell xenograft in zebrafish embryos. Representative fluorescence images of 72 hpf Tg(fli1a:EGFP)y1 zebrafish embryos implanted at 48 hpf with TT cells and subsequently treated for 24 h with dimethyl sulfoxide (DMSO) (a,d), VAN (b,e) and CAB (c,f). The red channel, corresponding to TT cells, was omitted in panels d, e, and f to highlight the tumor-induced microvascular network. Grafted larvae showed vessels in green that sprout from the sub-intestinal vein (SIV) toward the xenograft. Quantification of tumor-induced angiogenesis in TT-injected Tg(fli1a:EGFP)y1 embryos after 24 h of VAN (g) and CAB (h) treatments at different concentrations. Control (CTR) values have been set to 1.0. Graphed values represent the mean ± S.E.M. *** p < 0.001 versus CTR. Embryos are shown anterior to the left. Scale bar: 100 µm.
Figure 7
Figure 7
Effect of vandetanib (VAN) and cabozantinib (CAB) treatments on tumor-induced angiogenesis after MZ-CRC-1 cell xenograft in zebrafish embryos. Representative fluorescence images of 72 hpf Tg(fli1a:EGFP)y1 zebrafish embryos implanted at 48 hpf with MZ-CRC-1 cells and subsequently treated for 24 h with dimethyl sulfoxide (DMSO) (a,d), VAN (b,e) and CAB (c,f). The red channel, corresponding to MZ-CRC-1 cells, was omitted in panels d, e, and f to highlight the tumor-induced microvascular network. Grafted larvae showed vessels in green that sprout from the sub-intestinal vein (SIV) toward the xenograft. Quantification of tumor-induced angiogenesis in MZ-CRC-1-injected Tg(fli1a:EGFP)y1 embryos after 24 h of VAN (g) and CAB (h) treatments at different concentrations. Control (CTR) values have been set to 1.0. Graphed values represent the mean ± S.E.M. * p < 0.05 versus the CTR; *** p < 0.001 versus the CTR. Embryos are shown anterior to the left. Scale bar: 100 µm.

Similar articles

Cited by

References

    1. Fagin J.A., Wells S.A., Jr. Biologic and Clinical Perspectives on Thyroid Cancer. N. Engl. J. Med. 2016;375:2307. doi: 10.1056/NEJMra1501993. - DOI - PubMed
    1. Cancela-Nieto M.G., Sanchez-Sobrino P., Velogarcia A. Procalcitonin as a marker of medullary thyroid carcinoma. Minerva Endocrinol. 2020 doi: 10.23736/S0391-1977.20.03229-0. - DOI - PubMed
    1. Fialkowski E.A., Moley J.F. Current approaches to medullary thyroid carcinoma, sporadic and familial. J. Surg. Oncol. 2006;94:737–747. doi: 10.1002/jso.20690. - DOI - PubMed
    1. Raue F., Frank-Raue K. Update on Multiple Endocrine Neoplasia Type 2: Focus on Medullary Thyroid Carcinoma. J. Endocr. Soc. 2018;2:933–943. doi: 10.1210/js.2018-00178. - DOI - PMC - PubMed
    1. Mulligan L.M., Kwok J.B., Healey C.S., Elsdon M.J., Eng C., Gardner E., Love D.R., Mole S.E., Moore J.K., Papi L., et al. Germ-line mutations of the RET proto-oncogene in multiple endocrine neoplasia type 2A. Nature. 1993;363:458–460. doi: 10.1038/363458a0. - DOI - PubMed

Publication types

MeSH terms

Supplementary concepts