. 2021 Mar 16;9(3):307.
doi: 10.3390/biomedicines9030307.

Effect of NIR Laser Therapy by MLS-MiS Source on Fibroblast Activation by Inflammatory Cytokines in Relation to Wound Healing

Affiliations

Effect of NIR Laser Therapy by MLS-MiS Source on Fibroblast Activation by Inflammatory Cytokines in Relation to Wound Healing

Shirley Genah et al. Biomedicines. .

Abstract

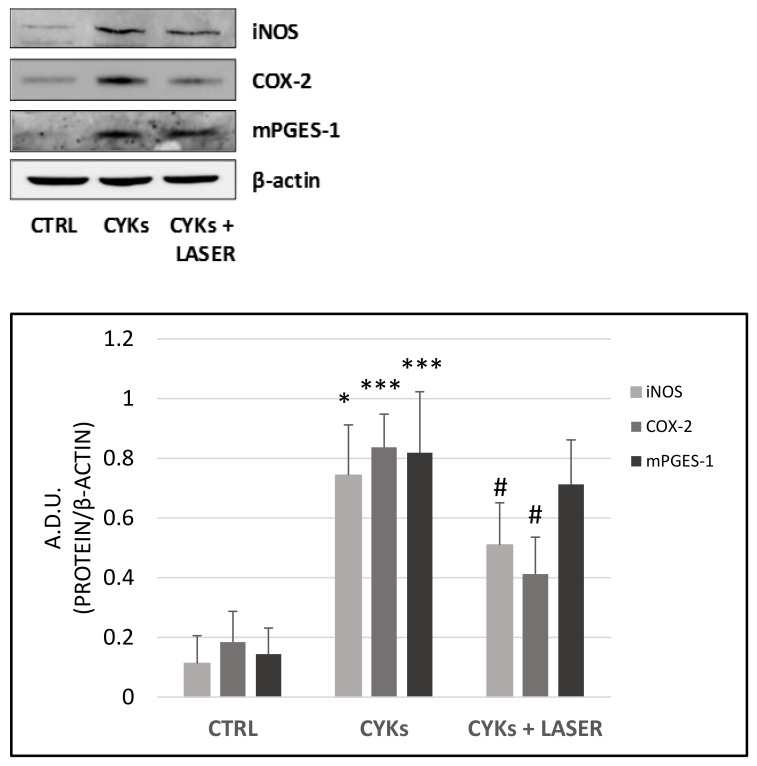
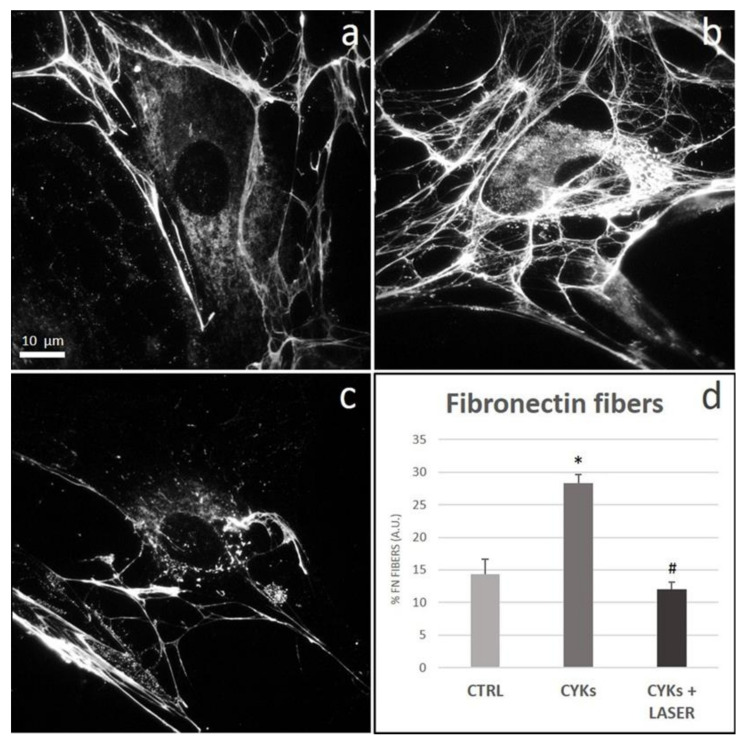
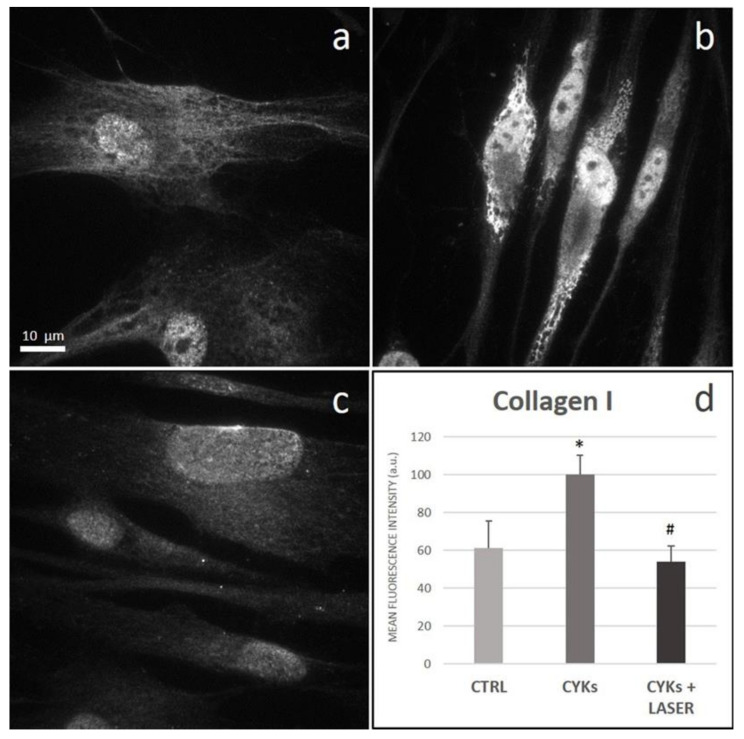
The fine control of inflammation following injury avoids fibrotic scars or impaired wounds. Due to side effects by anti-inflammatory drugs, the research is continuously active to define alternative therapies. Among them, physical countermeasures such as photobiomodulation therapy (PBMT) are considered effective and safe. To study the cellular and molecular events associated with the anti-inflammatory activity of PBMT by a dual-wavelength NIR laser source, human dermal fibroblasts were exposed to a mix of inflammatory cytokines (IL-1β and TNF-α) followed by laser treatment once a day for three days. Inducible inflammatory key enzymatic pathways, as iNOS and COX-2/mPGES-1/PGE2, were upregulated by the cytokine mix while PBMT reverted their levels and activities. The same behavior was observed with the proangiogenic factor vascular endothelial growth factor (VEGF), involved in neovascularization of granulation tissue. From a molecular point of view, PBMT retained NF-kB cytoplasmatic localization. According to a change in cell morphology, differences in expression and distribution of fundamental cytoskeletal proteins were observed following treatments. Tubulin, F-actin, and α-SMA changed their organization upon cytokine stimulation, while PBMT reestablished the basal localization. Cytoskeletal rearrangements occurring after inflammatory stimuli were correlated with reorganization of membrane α5β1 and fibronectin network as well as with their upregulation, while PBMT induced significant downregulation. Similar changes were observed for collagen I and the gelatinolytic enzyme MMP-1. In conclusion, the present study demonstrates that the proposed NIR laser therapy is effective in controlling fibroblast activation induced by IL-1β and TNF-α, likely responsible for a deleterious effect of persistent inflammation.

Keywords: NIR laser radiation; fibroblasts; inflammation; photobiomodulation; wound healing.


Conflict of interest statement

The authors declare no conflict of interest. The sponsors had no role in the design of the study, in the collection, analyses, or interpretation of data, in the writing of the manuscript, or in the decision to publish the results.

Figures

Figure 1
Figure 1
Development of an inflammation model on normal human dermal fibroblast (NHDF) cells. Fibroblasts were treated with IL-1β (10 ng/mL) + TNF-α (10 ng/mL) for 24 h and 48 h. Whole cell lysates were collected to assess mPGES-1 expression by Western blot (upper panel). Samples A and B represent intra-experimental duplicates. The measurement of PGE-2 performed by immunoenzymatic assay is reported (lower panel). At both times, there is an upregulation of the prostanoid system. Data represent means +/− SD (n = 3) *** p < 0.001 CYKs group vs. CTRL group.
Figure 2
Figure 2
Effect of laser treatment on NDHF cells stimulated with pro-inflammatory cytokines. Fibroblasts were treated with IL-1β and TNF-α, each at 10 ng/mL for 48 h, then culture medium was replaced by fresh culture medium and samples divided into 3 groups: CYKs + Laser—samples stimulated with cytokine mix and then exposed to laser treatments (3 treatments, repeated once a day, for 3 consecutive days); CYKs—samples stimulated with cytokine mix and not exposed to laser treatment; CTRL—samples not stimulated and not exposed to laser treatment. Six hours after the third laser treatment, whole cell lysates of all samples were collected, and Western blot was performed to assess protein abundance of iNOS, COX-2, and mPGES-1 (upper panel). Immunoblots were analyzed by densitometry and the results, expressed as arbitrary density units (A.D.U.), were normalized to β-Actin (lower panel). Data represent means +/− SD (n = 2) * p < 0.05 and *** p < 0.001 CYKs group vs. CTRL group, # p <0.05 CYKs + Laser group vs. CYKs group.
Figure 3
Figure 3
Modulation of PGE-2 and vascular endothelial growth factor (VEGF) release in NHDF cells exposed to pro-inflammatory cytokines and laser treatment. Fibroblasts were treated with IL-1β and TNF-α, each at 10 ng/mL for 48 h, then the culture medium was replaced by fresh culture medium and samples divided into 3 groups: CYKs + Laser—samples stimulated with cytokine mix and then exposed to laser treatments (3 treatments, repeated once a day, for 3 consecutive days); CYKs—samples stimulated with cytokine mix and not exposed to laser treatment; CTRL—samples not stimulated and not exposed to laser treatment. Six hours after the third laser treatment, all samples were recovered, and PGE-2 (upper panel) and VEGF (lower panel) levels were evaluated in conditioned media using specific ELISA kits. Dosing of each condition was performed in double, and quantification is expressed as pg/mL. Data represent means +/− SD (n = 2) ** p < 0.01 and *** p < 0.001 CYKs group vs. CTRL group, ### p < 0.001 CYKs + Laser group vs. CYKs group.
Figure 4
Figure 4
Laser treatment reduces inflammatory response in NHDF cells by limiting NF-κB translocation into the nucleus and down-regulating COX-2 and VEGF expression. Confocal analysis of NF-κB (panels (ad)), COX-2 (panels (eh)) and VEGF (panels (il)) expression and localization (magnification 63×) evaluated by immunofluorescence on NHDF in basal conditions (CTRL; panels (a,e,i)), stimulated with IL-1β and TNF-α for 48 h (CYKs; panels (b,f,j)), stimulated with IL-1β and TNF-α for 48 h, and then exposed to laser treatments (3 treatments, repeated once a day, for 3 consecutive days) (CYKs + LASER; panels (c,g,k)) and exposed to laser alone (LASER; panels (d,h,l)). For each series, the left panels show the protein of interest in red, while DAPI staining (blue) was merged on the right panels. White arrows indicate cells with nuclear localization of NF-kB. Bar = 25 µm.
Figure 5
Figure 5
Effect of laser treatment on tubulin, α-actin, α-SMA expression, and distribution. Microscopy analysis of tubulin (a-c), α-actin (df), and α-SMA (gi) expression evaluated by immunofluorescence (magnification 100×) on NHDF in basal conditions (CTRL; panels (a,d,g)), stimulated with IL-1β and TNF-α for 48 h (CYKs; panels (b,e,h)), stimulated with IL-1β and TNF-α for 48 h, and then exposed to laser treatments (3 treatments, repeated once a day, for 3 consecutive days) (CYKs + Laser; panels (c,f,i)). Bar = 10 µm.
Figure 6
Figure 6
Effect of laser treatment on α5β1 expression and distribution. Microscopy analysis of α5β1 expression evaluated by immunofluorescence (magnification 100×) on NHDF in basal conditions (CTRL; panel (a)), stimulated with IL-1β and TNF-α for 48 h (CYKs; panel (b)), stimulated with IL-1β and TNF-α for 48 h and then exposed to laser treatments (3 treatments, repeated once a day, for 3 consecutive days) (CYKs + Laser; panel (c)). Bar = 10 µm. The histogram reports the mean pixel intensity, acquired by ImageJ software after appropriate thresholding and subsequent image masking (panel (d)). * p < 0.05 CYKs group vs. CTRL group; # p < 0.05 CYKs + Laser group vs. CYKs group (n = 3).
Figure 7
Figure 7
Effect of laser treatment on fibronectin expression and organization. Microscopy analysis of fibronectin expression evaluated by immunofluorescence (magnification 100×) on NHDF in basal conditions (CTRL; panel (a)), stimulated with IL-1β and TNF-α for 48 h (CYKs; panel (b)), stimulated with IL-1β and TNF-α for 48 h and then exposed to laser treatments (3 treatments, repeated once a day, for 3 consecutive days) (CYKs + Laser; panel (c)). Bar = 10 µm. The histogram reports the % of the surface area with fibers, acquired by ImageJ software after appropriate thresholding to only include the stained fibers (panel (d)). * p < 0.05 CYKs group vs. CTRL group; # p < 0.05 CYKs + Laser group vs. CYKs group (n = 3).
Figure 8
Figure 8
Effect of laser treatment on Collagen I expression and distribution. Microscopy analysis of Collagen I expression evaluated by immunofluorescence (magnification 100×) on NHDF in basal conditions (CTRL; panel (a)), stimulated with IL-1β and TNF-α for 48 h (CYKs; panel (b)), stimulated with IL-1β and TNF-α for 48 h and then exposed to laser treatments (3 treatments, repeated once a day, for 3 consecutive days) (CYKs + Laser; panel (c)). Bar = 10 µm. The histogram reports the mean pixel intensity, acquired by ImageJ software after appropriate thresholding and subsequent image masking (panel (d)). * p < 0.05 CYKs group vs. CTRL group; # p < 0.05 CYKs + Laser group vs. CYKs group (n = 3).
Figure 9
Figure 9
Effect of laser treatment on MMP-1 expression and distribution. Microscopy analysis of MMP-1 expression evaluated by immunofluorescence (magnification 100×) on NHDF in basal conditions (CTRL; panel (a)), stimulated with IL-1β and TNF-α for 48 h (CYKs; panel (b)), stimulated with IL-1β and TNF-α for 48 h and then exposed to laser treatments (3 treatments, repeated once a day, for 3 consecutive days) (CYKs + Laser; panel (c)). Bar = 10 µm. The histogram reports the mean pixel intensity, acquired by ImageJ software after appropriate thresholding and subsequent image masking (panel (d)). * p < 0.05 CYKs group vs. CTRL group; # p < 0.05 CYKs + Laser group vs. CYKs group (n = 3).

Similar articles

Cited by

References

    1. Takeuchi O., Akira S. Pattern recognition receptors and inflammation. Cell. 2010;140:805–820. doi: 10.1016/j.cell.2010.01.022. - DOI - PubMed
    1. Shaw T.J., Martin P. Wound repair: A showcase for cell plasticity and migration. Curr. Opin. Cell Biol. 2016;42:29–37. doi: 10.1016/j.ceb.2016.04.001. - DOI - PubMed
    1. Wynn T.A., Vannella K.M. Macrophages in tissue repair, regeneration, and fibrosis. Immunity. 2016;44:450–462. doi: 10.1016/j.immuni.2016.02.015. - DOI - PMC - PubMed
    1. Medzhitov R. Origin and physiological roles of inflammation. Nature. 2008;454:428–435. doi: 10.1038/nature07201. - DOI - PubMed
    1. Glaros T. Macrophages and fibroblasts during inflammation, tissue damage and organ injury. Front. Biosci. 2009;14:3988–3993. doi: 10.2741/3506. - DOI - PubMed

LinkOut - more resources