. 2021 Mar 22;13(3):526.
doi: 10.3390/v13030526.

Multiple Early Introductions of SARS-CoV-2 to Cape Town, South Africa

Affiliations

Multiple Early Introductions of SARS-CoV-2 to Cape Town, South Africa

Susan Engelbrecht et al. Viruses. .

Abstract

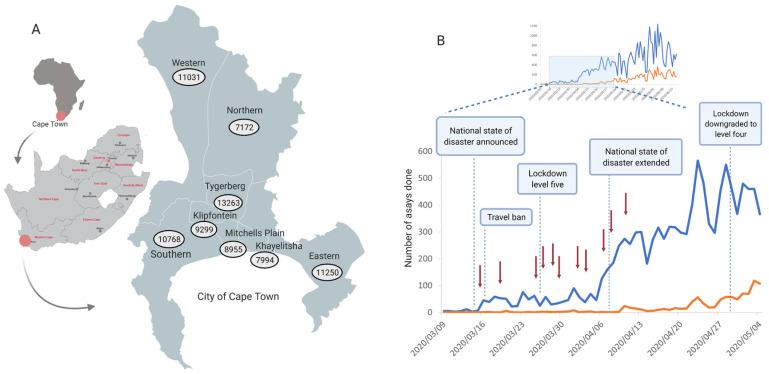
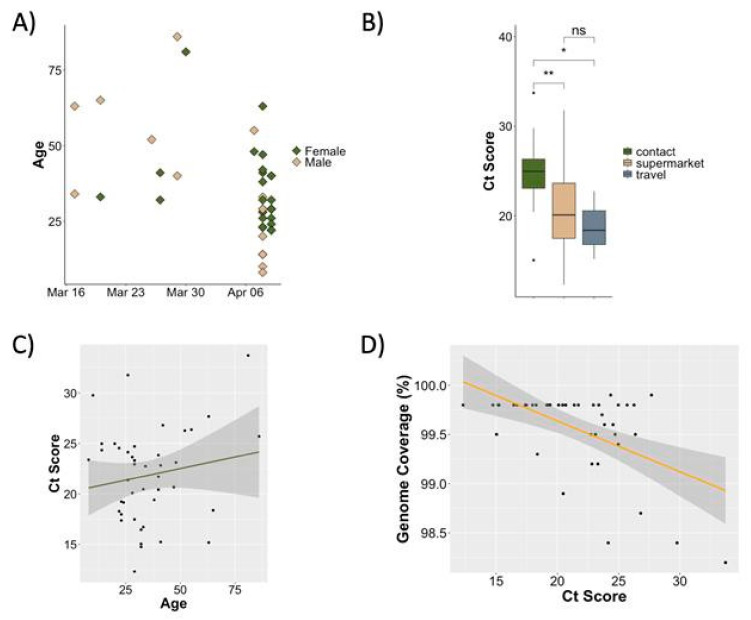
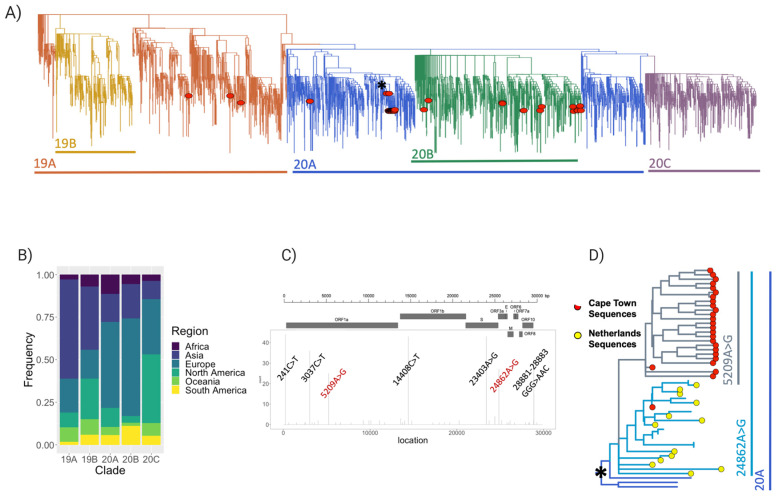
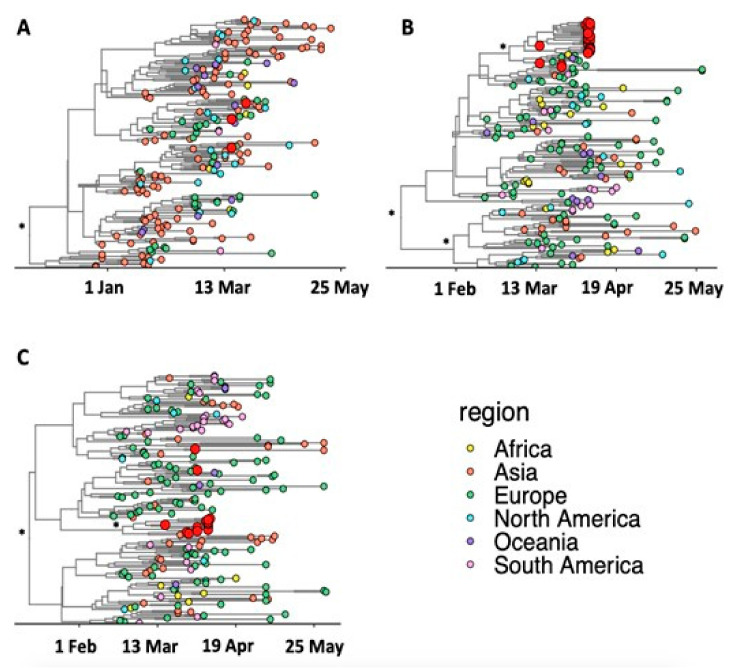
Cape Town was the first city in South Africa to experience the full impact of the coronavirus disease 2019 (COVID-19) pandemic. We acquired samples from all suspected cases and their contacts during the first month of the pandemic from Tygerberg Hospital. Nanopore sequencing generated SARS-CoV-2 whole genomes. Phylogenetic inference with maximum likelihood and Bayesian methods were used to determine lineages that seeded the local epidemic. Three patients were known to have travelled internationally and an outbreak was detected in a nearby supermarket. Sequencing of 50 samples produced 46 high-quality genomes. The sequences were classified as lineages: B, B.1, B.1.1.1, B.1.1.161, B.1.1.29, B.1.8, B.39, and B.40. All the sequences from persons under investigation (PUIs) in the supermarket outbreak (lineage B.1.8) fall within a clade from the Netherlands with good support (p > 0.9). In addition, a new mutation, 5209A>G, emerged within the Cape Town cluster. The molecular clock analysis suggests that this occurred around 13 March 2020 (95% confidence interval: 9-17 March). The phylogenetic reconstruction suggests at least nine early introductions of SARS-CoV-2 into Cape Town and an early localized transmission in a shopping environment. Genomic surveillance was successfully used to investigate and track the spread of early introductions of SARS-CoV-2 in Cape Town.

Keywords: COVID-19; Cape Town; SARS-CoV-2; South Africa; Western Cape Province; betacoronavirus; genome sequencing; molecular epidemiology; mutation; phylogenetics.


Conflict of interest statement

The authors declare no conflict of interest.

Figures

Figure 1
Figure 1
Epidemiology of SARS-CoV-2 in the Western Cape and the City of Cape Town. (A) Map of South Africa indicating the different provinces with a map of cases in the Cape Town Metropole on 31 July 2020 in the eight different health subdistricts. Data were obtained from the Western Cape Provincial Government, https://coronavirus.westerncape.gov.za, last accessed 21 March 2021. (B) Graphical presentation of the number of SARS-CoV-2 assays carried out and the number of positive cases at the Virology Division, NHLS, Tygerberg. The detailed view from 9 March 2020 indicates the timeline of the government response to the epidemic, with red arrows indicating early sample collection for sequencing at Tygerberg Hospital. Figure created using BioRender (https://biorender.com, last accessed 21 March 2021).
Figure 2
Figure 2
SARS-CoV-2 samples. (A) Scatter plot of samples obtained for this study showing sampling dates, age, and gender of patients. (B) Patient exposure status denoting whether patients had any travel history (grey), were part of a supermarket outbreak (brown) or were contacts of known cases (green). The Ct values may correlate with timing of sample collection. (C) The relationship between age of patients and Ct score. A p-value less than 0.05, is flagged with one star (*) and a p-value less than 0.01, is flagged with two stars (**) (D) The relationship between Ct score and resulting genome coverage after sequencing, showing higher overall genome coverage (hence sequence quality) from samples with lower Ct scores (higher viral loads).
Figure 3
Figure 3
Phylogenetic and lineage analysis. (A) A time-scaled maximum-likelihood tree of 3620 sequences and 47 genotypes from Cape Town, Western Cape, South Africa. Major lineages of SARS-CoV-2 are labelled. (B) Stacked bar plot showing the lineage breakdown of the dataset by region, indicating the over-representation of lineage 20A (where most of the Cape Town sequences lie) with origins from Europe. (C) Genomic location and frequency of variants among the 47 genomes generated in this study mapped onto the genomic structure of SARS-CoV2, with common variants labelled. Variants labelled in red are observed either uniquely or at higher frequencies in our sequences compared to their global distribution. (D) Monophyletic cluster within the Cape Town sequences, showing closest divergence from isolates originating in the Netherlands, and the emergence of a Cape Town specific mutation within that cluster. This is a zoom-in of the tree in (A) at the position indicated by the asterisk (*).
Figure 4
Figure 4
Bayesian Maximum Clade Credibility trees of major SARS-CoV-2 clades. (A) Clade 19A, (B) Clade 20 A and (C) Clade 20B. The sequences are colored according to their region of sampling, while Cape Town sequences are labelled in red. The branches of the tree topology are in calendar time while well-supported splits in the tree topology (posterior support > 0.9) are marked with an asterisk (*).

Similar articles

Cited by

References

    1. Morens D.M., Daszak P., Markel H., Taubenberger J.K. Pandemic COVID-19 Joins History’s Pandemic Legion. mBio. 2020;11:e00812-20. doi: 10.1128/mBio.00812-20. - DOI - PMC - PubMed
    1. Drosten C., Günther S., Preiser W., van der Werf S., Brodt H.R., Becker S., Rabenau H., Panning M., Kolesnikova L., Fouchier R.A., et al. Identification of a novel coronavirus in patients with severe acute respiratory syndrome. N. Engl. J. Med. 2003;348:1967–1976. doi: 10.1056/NEJMoa030747. - DOI - PubMed
    1. Novel Swine-Origin Influenza A (H1N1) Virus Investigation Team. Dawood F.S., Jain S., Finelli L., Shaw M.W., Lindstrom S., Garten R.J., Gubareva L.V., Xu X., Bridges C.B., et al. Emergence of a novel swine-origin influenza A (H1N1) virus in humans. N. Engl. J. Med. 2009;360:2605–2615. doi: 10.1056/NEJMoa0903810. Erratum in 2009, 361, 102. - DOI - PubMed
    1. Smith G.J., Vijaykrishna D., Bahl J., Lycett S.J., Worobey M., Pybus O.G., Ma S.K., Cheung C.L., Raghwani J., Bhatt S., et al. Origins and evolutionary genomics of the 2009 swine-origin H1N1 influenza A epidemic. Nature. 2009;459:1122–1125. doi: 10.1038/nature08182. - DOI - PubMed
    1. Faria R.N., Lourenço J., Marques de Cerqueira E., Maia de Lima M., Pybus O., Carlos Junior Alcantara L. Epidemiology of Chikungunya Virus in Bahia, Brazil, 2014–2015. PLoS Curr. 2016;8 doi: 10.1371/currents.outbreaks.c97507e3e48efb946401755d468c28b2. - DOI - PMC - PubMed

Publication types

MeSH terms

LinkOut - more resources