. 2021 Mar 26;13(7):1528.
doi: 10.3390/cancers13071528.

The Association between TIF1 Family Members and Cancer Stemness in Solid Tumors

Affiliations

The Association between TIF1 Family Members and Cancer Stemness in Solid Tumors

Patrycja Czerwinska et al. Cancers (Basel). .

Abstract

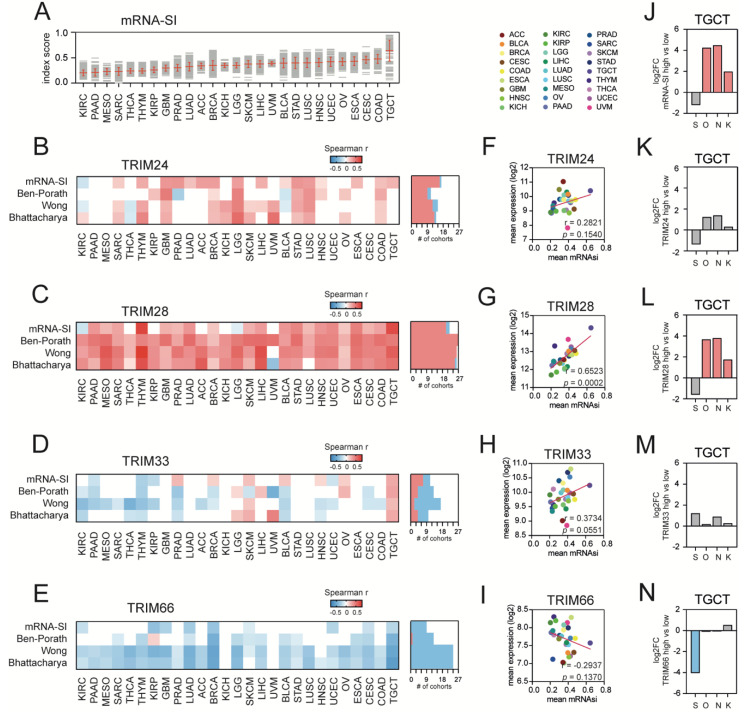
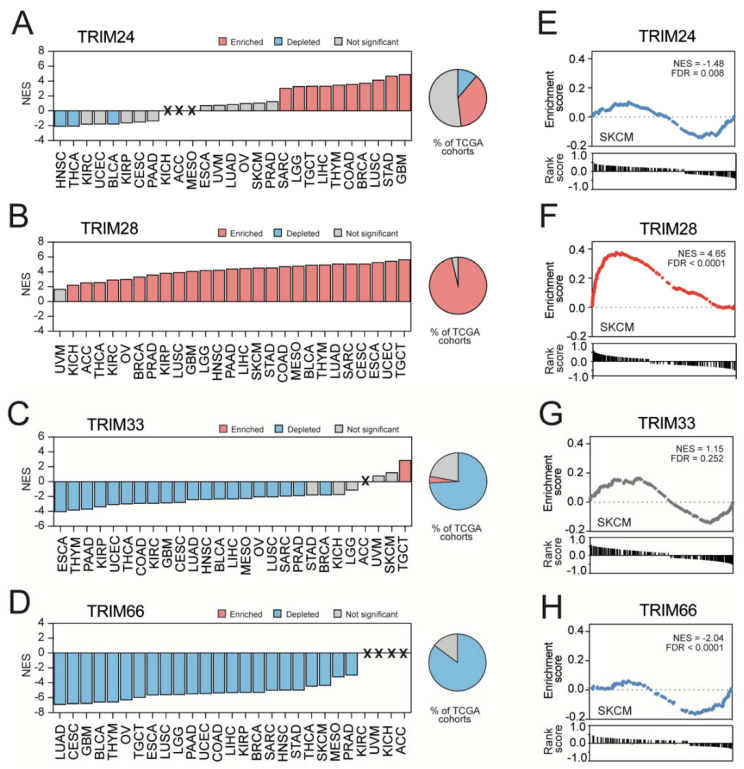
Cancer progression entails a gradual loss of a differentiated phenotype in parallel with the acquisition of stem cell-like features. Cancer de-differentiation and the acquisition of stemness features are mediated by the transcriptional and epigenetic dysregulation of cancer cells. Here, using publicly available data from The Cancer Genome Atlas (TCGA) and Gene Expression Omnibus (GEO) databases and harnessing several bioinformatic tools, we characterized the association between Transcriptional Intermediary Factor 1 (TIF1) family members and cancer stemness in 27 distinct types of solid tumors. We aimed to define the prognostic value for TIF1 members in predicting a stem cell-like cancer phenotype and patient outcome. Our results demonstrate that high expression of only one member of the TIF1 family, namely TIF1β (also known as Tripartite Motif protein 28, TRIM28) is consequently associated with enriched cancer stemness across the tested solid tumor types, resulting in a worse prognosis for cancer patients. TRIM28 is highly expressed in higher grade tumors that exhibit stem cell-like traits. In contrast to other TIF1 members, only TIF1β/TRIM28-associated gene expression profiles were robustly enriched with stemness markers regardless of the tumor type. Our work demonstrates that TIF1 family members exhibit distinct expression patterns in stem cell-like tumors, despite their structural and functional similarity. Among other TIF1 members, only TRIM28 might serve as a marker of cancer stemness features.

Keywords: TCGA; TIF1; TRIM28; cancer stemness; stemness score.


Conflict of interest statement

The authors declare no conflict of interest. The funders had no role in the design of the study; in the collection, analyses, or interpretation of data; in the writing of the manuscript, or in the decision to publish the results.

Figures

Figure 1
Figure 1
The expression of Transcriptional Intermediary Factor 1 (TIF1) family members across distinct solid tumor types. The expression of (A) Tripartite Motif protein 24 (TRIM24), (B) TRIM28, (C) TRIM33, and (D) TRIM66 in 27 solid tumor types based on RNA Seq RSEM V2 data from The Cancer Genome Atlas database (TCGA) (top panel). Each grey line represents a single tumor sample. The mean value and standard deviation (SD) within tumor type are marked with red. The bottom panel presents the hazard ratio (lnHR) of death for patients with high expression of specific TIF1 family members (with the mean as a cut-off). Red and blue denotes statistically significantly higher or lower hazard ratios, respectively. The HRs for individual tumor types are given with 95% confidence intervals (CIs). Tumor types: ACC—adrenocortical carcinoma; BLCA—bladder urothelial carcinoma; BRCA—breast invasive carcinoma; CESC—cervical squamous cell carcinoma and endocervical adenocarcinoma; COAD—colorectal adenocarcinoma; ESCA—esophageal carcinoma; GBM—glioblastoma multiforme; HNSC—head and neck squamous cell carcinoma; KICH—kidney chromophobe; KIRC—kidney renal clear cell carcinoma; KIRP—kidney renal papillary cell carcinoma; LGG—brain lower grade glioma; LIHC—liver hepatocellular carcinoma; LUAD—lung adenocarcinoma; LUSC—lung squamous cell carcinoma; MESO—mesothelioma; OV—ovarian serous cystadenocarcinoma; PAAD—pancreatic adenocarcinoma; PRAD—prostate adenocarcinoma; SARC—sarcoma; SKCM—skin cutaneous melanoma; STAD—stomach adenocarcinoma; TGCT—testicular germ cell tumor; THCA—thyroid carcinoma; THYM—thymoma; UCEC—uterine corpus endometrial carcinoma; UVM—uveal melanoma.
Figure 2
Figure 2
The association of the expression of TIF1 family members with cancer stemness. (A) The transcriptome-based stemness index (mRNA-SI) calculated for 27 TCGA solid tumor types. (BE) The heatmap of Spearman’s correlation between (B) TRIM24, (C) TRIM28, (D) TRIM33, and (E) TRIM66 expression and distinct stemness scores (mRNA-Stemness Index, Ben-Porath ES core signature, Wong ESC core signature, Bhattacharya ESC signature). Note the strong positive association between TRIM28 expression and stemness indices and the negative association between TRIM66 expression and stemness indices across distinct tumor types. The number of TCGA cohorts characterized with either a positive (red) or negative (blue) correlation between the expression of specific TIF1 family members and tested stemness scores/signatures are shown. (FI) The Spearman’s correlation between the mean TRIM24 (F), TRIM28 (G), TRIM33 (H), or TRIM66 (I) expression level and the average mRNA-SI score across 27 solid tumor types. (J) mRNA-SIHIGH TGCT tumors express significantly higher levels of stemness transcription factors Octamer-binding transcription factor 4 (OCT-3/4), Nanog Homeobox (Nanog), and Kruppel Like Factor 4 (KLF4). (KN) Among other TIF1 members, only TRIM28HIGH TGCT tumors express significantly higher levels of OCT-3/4, Nanog, and KLF4. S–SOX2 (SRY (sex determining region Y)-box 2), O–OCT-3/4, N–NANOG, and K–KLF4. Red—significant upregulation; blue—significant downregulation; grey—no statistical significance (FDR > 1%).
Figure 3
Figure 3
The level of mRNA-SI and TIF1 expression in lower and higher grade tumors. (A) Higher grade tumors exhibit higher mRNA-SI values as presented for LIHC (left panel), UCEC (middle panel), and CESC (right panel). G1–G4—grade 1–4 (the “neoplasm histologic grade” feature from TCGA data). (BE) Among the other TIF1 family members, the expression of TRIM28 is significantly elevated in higher grade tumors. (F) Hematoxylin–eosin staining of lower and higher grade PRAD tumors. (GJ) Representative immunohistochemistry staining for TRIM24 (G), TRIM28 (H), TRIM33 (I), and TRIM66 (J) of lower and higher grade PRAD tumors (from www.proteinatlas.org, accessed on 10 August 2020).
Figure 4
Figure 4
The hallmarks of cancer in mRNA-SI and TIF1-associated gene signatures. (A) The targets for c-Myc transcription factors are enriched, while the genes associated with hypoxia, Wnt/β-catenin signaling, Tumor Growth Factor-β (TGF-β) signaling, and Epithelial-Mesenchymal Transition (EMT) are depleted in the mRNA-SI gene signature. NES – Normalized Enrichment Score. Red—enriched terms; blue—depleted terms; grey—no statistical significance (FDR >1%). (BE) The transcriptome profiles associated with TRIM24 (B), TRIM28 (C), TRIM33 (D), or TRIM66 (E) gene expression are differentially enriched or depleted with hallmarks of cancer terms, and TRIM28-associated transcriptome profiles are consequently enriched, while TRIM66-associated transcriptome profiles are consequently depleted with the targets for c-Myc transcription factor.
Figure 5
Figure 5
Stemness signature enrichment in transcriptome profiles associated with the expression of TIF1 family members. (AD) The Gene Set Enrichment Analysis (GSEA) using significantly correlated genes for (A) TRIM24, (B) TRIM28, (C) TRIM33, or (D) TRIM66 expression was performed with the stemness signature (Wong_ESC_Core) as a reference. Bar—normalized enrichment score (NES); X—gene sets that did not reach the size threshold (at least 15 genes). Blue and red denote a significant depletion or significant enrichment, respectively. (E,F) The GSEA using transcriptome profiles associated with the expression of (E) TRIM24, (F) TRIM28, (G) TRIM33, and (H) TRIM66 in SKCM revealed significant enrichment with the Kim_Myc_targets gene signature. The GSEA results for the Kim_Myc_targets gene signature enrichment in other tumor types are shown in Figure S3.
Figure 6
Figure 6
Stemness high tumors are associated with a worse prognosis, and TRIM28 high expression may predict stemness high phenotype. (A) The hazard ratio (lnHR) of death of 4-score stemnessHIGH patients across 27 TCGA tumor types (# - for KIRC, KIRP and LGG, the 3-score classifier was used). (B) Kaplan–Meier overall survival (OS) curves for 10 tumor types separated into stemnessHIGH (red) or not-stemnessHIGH (grey) cohorts. (CF) The expression of (C) TRIM24, (D) TRIM28, (E) TRIM33, and (F) TRIM66 in stemnessHIGH tumors. Log2-normalized fold change (log2FC) between the stemnessHIGH and other tumors is presented. (G) The diagnostic value of the TRIM28 expression in predicting the stemnessHIGH phenotype of 10 distinct TCGA cohorts. The area under the curve (AUC) was calculated for the Receiver Operating Characteristics (ROC) curve. (H) Similarly, the diagnostic value for other TIF1 family members in predicting the stemnessHIGH phenotype across 10 TCGA tumor types is shown. The AUCs for TRIM28 exhibit the highest values.

Similar articles

Cited by

References

    1. Friedmann-Morvinski D., Verma I.M. Dedifferentiation and reprogramming: Origins of cancer stem cells. EMBO Rep. 2014;15:244–253. doi: 10.1002/embr.201338254. - DOI - PMC - PubMed
    1. Czerwinska P., Kaminska B. Regulation of breast cancer stem cell features. Contemp. Oncol. 2015;19:A7–A15. doi: 10.5114/wo.2014.47126. - DOI - PMC - PubMed
    1. Visvader J.E., Lindeman G.J. Cancer stem cells: Current status and evolving complexities. Cell Stem Cell. 2012;10:717–728. doi: 10.1016/j.stem.2012.05.007. - DOI - PubMed
    1. Ben-Porath I., Thomson M.W., Carey V.J., Ge R., Bell G.W., Regev A., Weinberg R.A. An embryonic stem cell-like gene expression signature in poorly differentiated aggressive human tumors. Nat Genet. 2008;40:499–507. doi: 10.1038/ng.127. - DOI - PMC - PubMed
    1. Wong D.J., Liu H., Ridky T.W., Cassarino D., Segal E., Chang H.Y. Module map of stem cell genes guides creation of epithelial cancer stem cells. Cell Stem Cell. 2008;2:333–344. doi: 10.1016/j.stem.2008.02.009. - DOI - PMC - PubMed

LinkOut - more resources