. 2021 Mar 26;13(7):1531.
doi: 10.3390/cancers13071531.

Breast Cancer Patient Prognosis Is Determined by the Interplay between TP53 Mutation and Alternative Transcript Expression: Insights from TP53 Long Amplicon Digital PCR Assays

Affiliations

Breast Cancer Patient Prognosis Is Determined by the Interplay between TP53 Mutation and Alternative Transcript Expression: Insights from TP53 Long Amplicon Digital PCR Assays

Annette Lasham et al. Cancers (Basel). .

Abstract

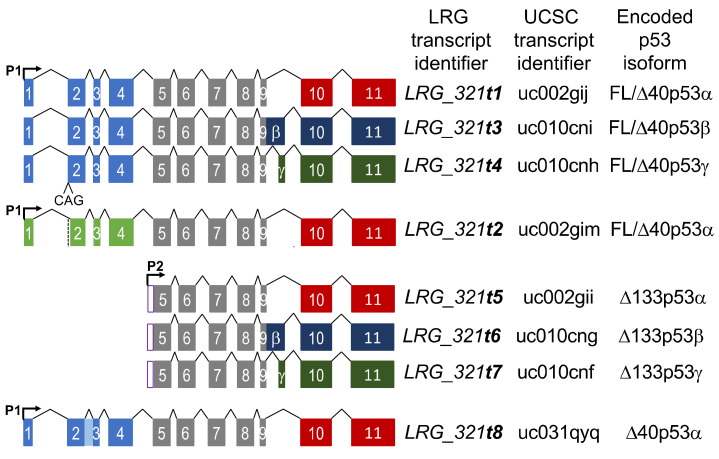
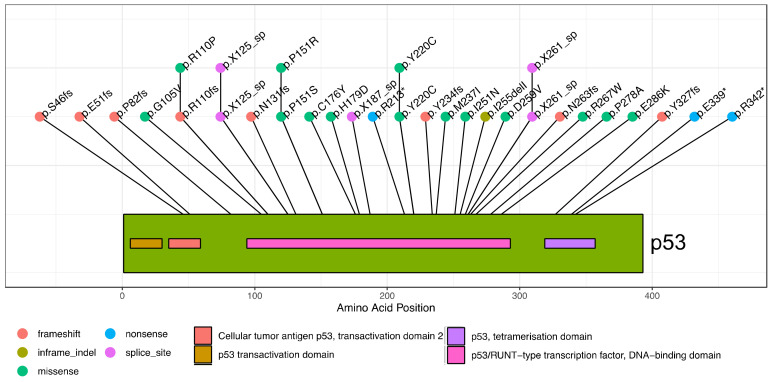
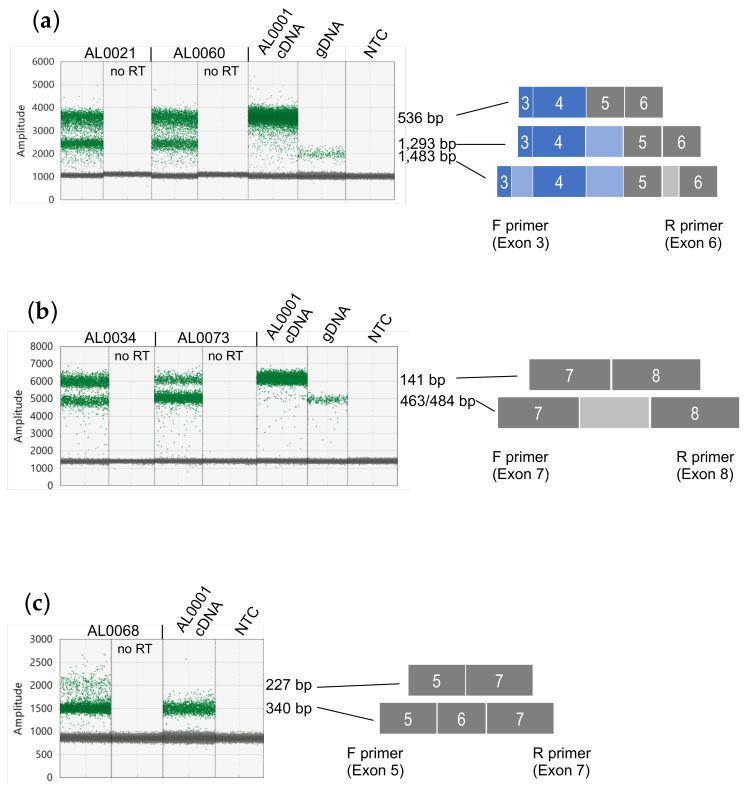
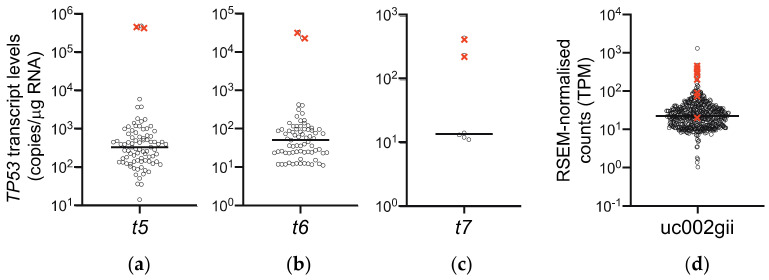
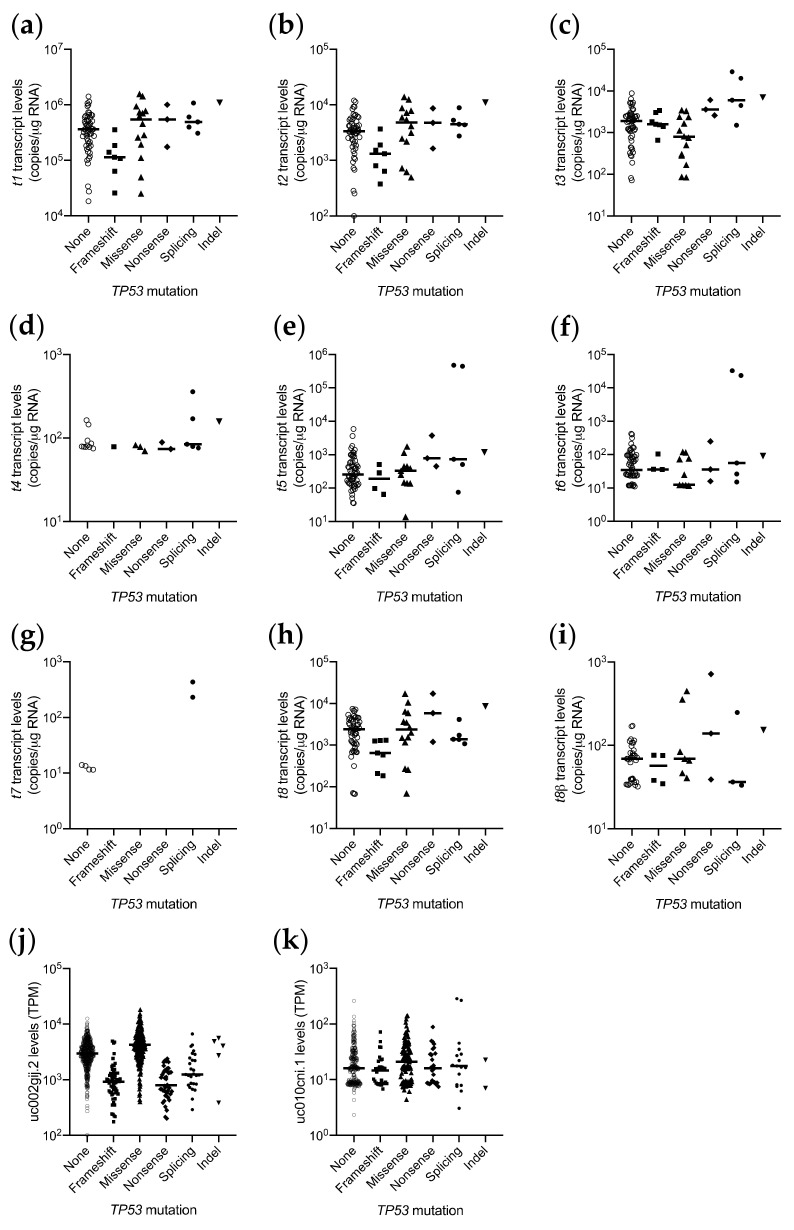
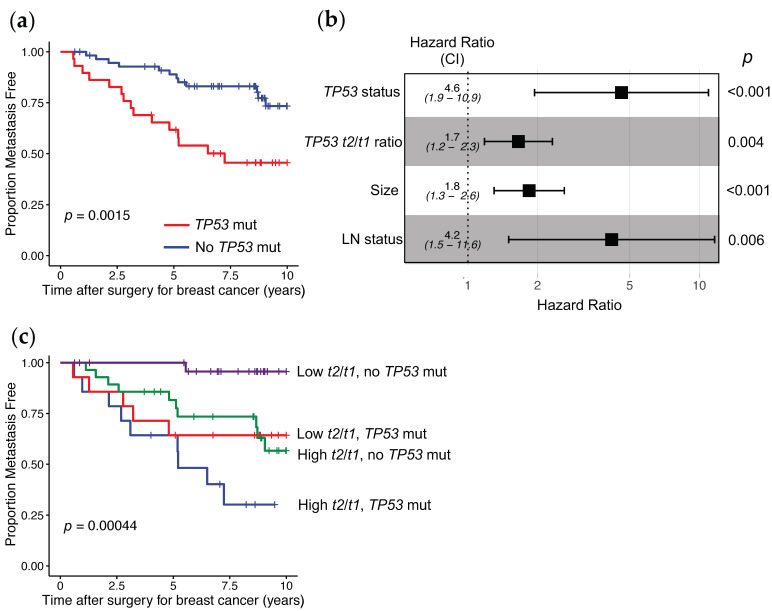
The TP53 gene locus is capable of producing multiple RNA transcripts encoding the different p53 protein isoforms. We recently described multiplex long amplicon droplet digital PCR (ddPCR) assays to quantify seven of eight TP53 reference transcripts in human tumors. Here, we describe a new long amplicon ddPCR assay to quantify expression of the eighth TP53 reference transcript encoding ∆40p53α. We then applied these assays, alongside DNA sequencing of the TP53 gene locus, to tumors from a cohort of New Zealand (NZ) breast cancer patients. We found a high prevalence of mutations at TP53 splice sites in the NZ breast cancer cohort. Mutations at TP53 intron 4 splice sites were associated with overexpression of ∆133TP53 transcripts. Cox proportional hazards survival analysis showed that interplay between TP53 mutation status and expression of TP53 transcript variants was significantly associated with patient outcome, over and above standard clinical and pathological information. In particular, patients with no TP53 mutation and a low ratio of TP53 transcripts t2 to t1, which derive from alternative intron 1 acceptor splice sites, had a remarkably good outcome. We suggest that this type of analysis, integrating mutation and transcript expression, provides a step-change in our understanding of TP53 in cancer.

Keywords: TP53 isoforms; alternative splicing; breast cancer prognosis; long amplicon digital PCR.


Conflict of interest statement

The authors declare no conflict of interest. The funders had no role in the design of the study; in the collection, analyses, or interpretation of data; in the writing of the manuscript, or in the decision to publish the results.

Figures

Figure 1
Figure 1
Schematic showing the structure of the eight TP53 reference transcripts. The Locus Reference Genome (LRG) transcript identifier, the UCSC transcript identifier and the predicted encoded p53 isoforms are also shown for each TP53 transcript. P1 and P2 refer to the P1 and P2 promoters, respectively. The light blue and light green boxes refer to transcripts with or without an additional CAG at the beginning of exon 2, respectively. The shaded light blue box between exons 2 and 3 is retention of intron 2 within the ∆40p53-encoding transcript, t8. The grey boxes indicate the exons common to all transcripts. The red, dark blue and dark green boxes refer to transcripts encoding α, β and γ C-terminal ends.
Figure 2
Figure 2
Lollipop plot showing location and sequence of TP53 mutations in breast cancer cohort. The individual mutations are indicated with their amino acid change given. Mutations preceded with “X” are splice site mutations, located within introns. The color of the lollipop indicates the mutation type. A schematic of the p53 protein is shown, with domains indicated in the color key below the plot.
Figure 3
Figure 3
Validation of TP53 splicing mutations in breast cancer samples. (a) ddPCR assay between TP53 exons 3 and 6 showing amplification of TP53 transcripts. AL0021 and AL0060 have a point mutation in the TP53 intron 4 donor splice site at +1 and +5, respectively. AL0001 has no splicing mutations and was used as a control to show the fluorescence amplitude of a correctly spliced TP53 RNA (536 bp), whereas those TP53 RNAs retaining intron 4 have an amplicon size of 1293 bp. Genomic DNA (gDNA) was used as a control template to show an amplicon with retention of introns 3, 4 and 5. (b) ddPCR assay between TP53 exons 7 and 8 showing amplification of TP53 transcripts. AL0034 and AL0073 have a 21 bp deletion spanning the TP53 intron 7 donor splice site or a point mutation at +1 in the TP53 intron 7 donor splice site, respectively. AL0001 has no splicing mutations and was used as a control to show the fluorescence amplitude of a correctly spliced TP53 RNA (141 bp), whereas those TP53 RNAs retaining intron 7 have an amplicon size of 463 or 484 bp for AL0034 and AL0073, respectively. Genomic DNA (gDNA) was used as a control template to show an amplicon with retention of intron 7 (484 bp). (c) ddPCR assay between TP53 exons 5 and 7 showing amplification of TP53 transcripts. AL0068 has a point mutation at −1 in the TP53 intron 5 acceptor splice site. AL0001 has no splicing mutations and was used as a control to show the fluorescence amplitude of a correctly spliced TP53 RNA (340 bp), whereas those TP53 RNAs skipping exon 6 have an amplicon size of 227 bp. ddPCR results shown are “1-D” plots, with green dots representing droplets where PCR products have been amplified and grey dots represent no amplified PCR product. The fluorescence amplitude (Amplitude) on the y-axes is indicative of amplicon size/s within each assay.
Figure 4
Figure 4
Scatterplots showing levels of transcripts encoding ∆133p53 isoforms in Breast Cancer cohorts. (ac) Results from long amplicon ddPCR of 85 NZ breast cancer samples with both known TP53 mutation status and TP53 transcript expression data. (a) LRG_321t5 encoding ∆133p53α (detectable in 83/85 tumors), (b) LRG_321t6 encoding ∆133p53β (detectable in 73/85 tumors), (c) LRG_321t7 encoding ∆133p53γ (detectable in 6/85 tumors) and (d) uc002gii TP53 transcript, assigned as encoding ∆133p53α, quantitated by RSEM analysis of RNA-seq data in 727 TCGA BRCA samples with known TP53 mutation status (TPM = transcripts per million reads). Black circles represent tumor samples expressing this transcript; for clarity samples have been jittered on the x-axis. Tumors with a TP53 intron 4 splice site mutation are indicated by ×. Horizontal line represents the median expression level for each cohort. Note that “detectable” refers to limit of detection of ddPCR assays, which is transcripts with abundance greater than 10 copies/μg RNA.
Figure 5
Figure 5
Scatterplots showing TP53 transcript abundance by TP53 mutation status in breast cancer cohorts. (ai) TP53 transcript levels in New Zealand breast cancer cohort, quantitated by long amplicon ddPCR. (a) LRG_321t1 encoding FL/∆40p53α, (b) LRG_321t2 encoding FL/∆40p53α, (c) LRG_321t3 encoding FL/∆40p53β, (d) LRG_321t4 encoding FL/∆40p53γ, (e) LRG_321t5 encoding ∆133p53α, (f) LRG_321t6 encoding ∆133p53β, (g) LRG_321t7 encoding ∆133p53γ, (h) LRG_321t8 encoding ∆40p53α, and (i) t8β encoding ∆40p53β, in each tumor. (j,k) TP53 transcript levels from the TCGA BRCA cohort, quantitated by RNA-seq, (j) uc002gij.2, encoding FL/∆40p53α, (k) uc010cni.1, encoding FL/∆40p53β. Bar represents the median, with symbols representing individual tumor samples.
Figure 6
Figure 6
Association of TP53 tumor information with distant metastases free survival in NZ breast cancer patients. (a) Kaplan–Meier curves showing the proportion of patients having a distant metastatic event by their TP53 tumor mutation status (log rank test p = 0.0015). Red line = patients with tumors with a TP53 mutation (n = 31), Blue line = patients with tumors with no TP53 mutation (n = 58). (b) Forest plot showing contribution of TP53 tumor information and clinicopathological features to a multivariable Cox proportional hazards model predicting those patients having a distant metastatic event (n = 83 with 27 patients developing distant metastases before 12 years, log rank test p = 4.2 × 10⁻⁸), CI = 95% confidence intervals, (c) Kaplan–Meier curves showing the proportion of patients having a distant metastatic event by their TP53 tumor mutation status and t2/t1 transcript level ratios to stratify patients into four groups (log rank test p = 4.4 × 10⁻⁴). “High” = greater than median and “Low” = less than median levels of t2/t1, Green line = patients with tumors with High t2/t1 levels and no TP53 mutation (n = 27), Blue line = patients with tumors with High t2/t1 levels and a TP53 mutation (n = 16), Purple line = patients with tumors with Low t2/t1 levels and no TP53 mutation (n = 28) and Red line = patients with tumors with Low t2/t1 levels and a TP53 mutation (n = 14).

References

    1. Kandoth C., McLellan M.D., Vandin F., Ye K., Niu B., Lu C., Xie M., Zhang Q., McMichael J.F., Wyczalkowski M.A., et al. Mutational landscape and significance across 12 major cancer types. Nature. 2013;502:333–339. doi: 10.1038/nature12634. - DOI - PMC - PubMed
    1. Bouaoun L., Sonkin D., Ardin M., Hollstein M., Byrnes G., Zavadil J., Olivier M. TP53Variations in Human Cancers: New Lessons from the IARC TP53 Database and Genomics Data. Hum. Mutat. 2016;37:865–876. doi: 10.1002/humu.23035. - DOI - PubMed
    1. Pereira B., Chin S.-F., Rueda O.M., Vollan H.-K.M., Provenzano E., Bardwell H.A., Pugh M., Jones L.A., Russell R., Sammut S.-J., et al. The somatic mutation profiles of 2433 breast cancers refine their genomic and transcriptomic landscapes. Nat. Commun. 2016;7:11479. doi: 10.1038/ncomms11479. - DOI - PMC - PubMed
    1. Donehower L.A., Soussi T., Korkut A., Liu Y., Schultz A., Cardenas M., Li X., Babur O., Hsu T.K., Lichtarge O., et al. Integrated Analysis of TP53 Gene and Pathway Alterations in The Cancer Genome Atlas. Cell Rep. 2019;28:1370–1384. doi: 10.1016/j.celrep.2019.07.001. - DOI - PMC - PubMed
    1. Banerji S., Cibulskis K., Rangel-Escareno C., Brown K.K., Carter S.L., Frederick A.M., Lawrence M.S., Sivachenko A.Y., Sougnez C., Zou L., et al. Sequence analysis of mutations and translocations across breast cancer subtypes. Nature. 2012;486:405–409. doi: 10.1038/nature11154. - DOI - PMC - PubMed

LinkOut - more resources