. 2021 Mar 26;10(4):266.
doi: 10.3390/biology10040266.

PER2 Circadian Oscillation Sensitizes Esophageal Cancer Cells to Chemotherapy

Affiliations

PER2 Circadian Oscillation Sensitizes Esophageal Cancer Cells to Chemotherapy

Juan Alfonso Redondo et al. Biology (Basel). .

Abstract

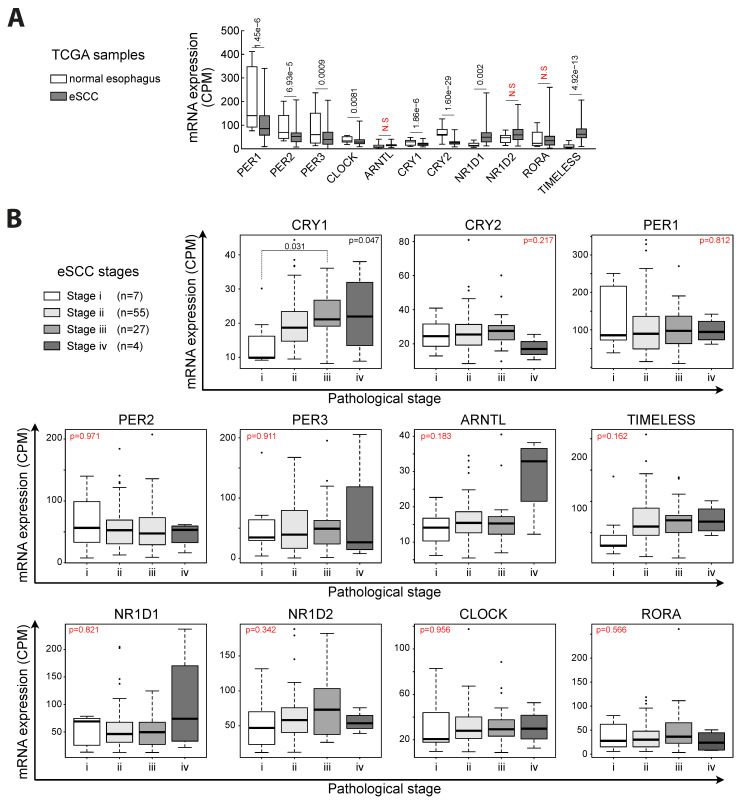
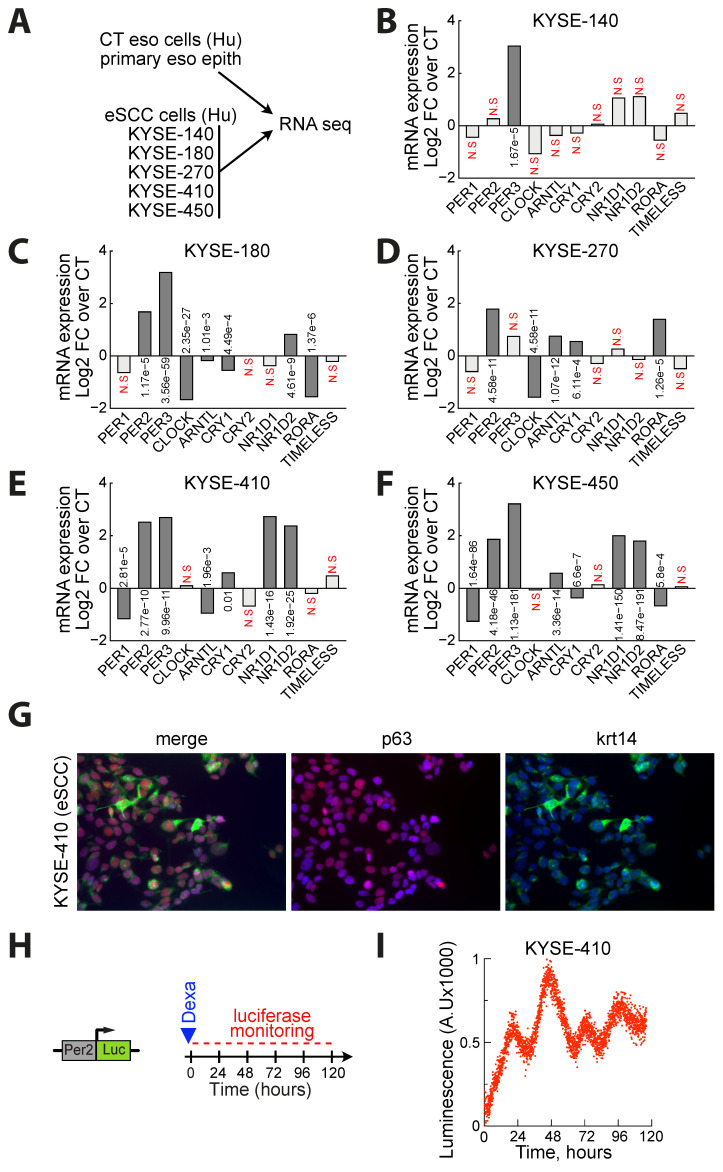
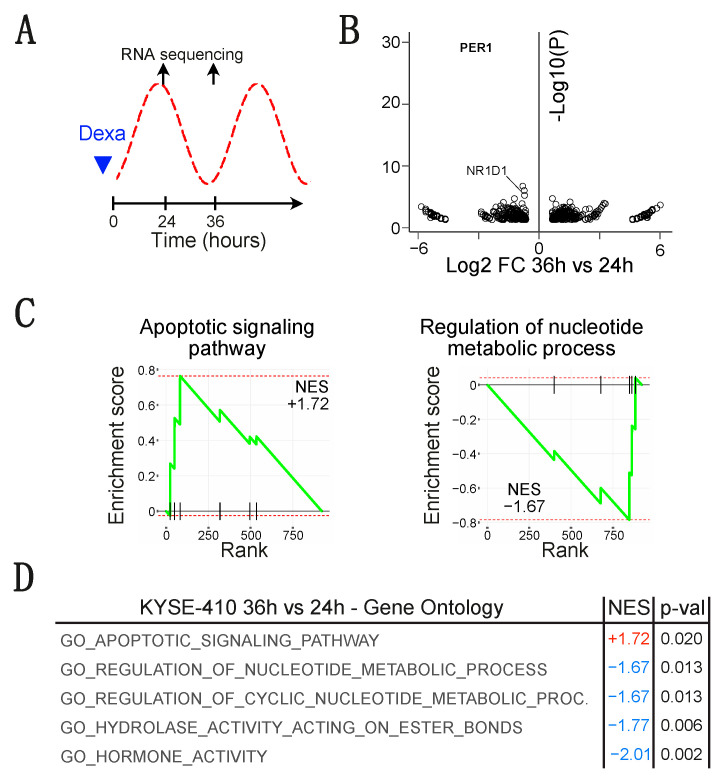
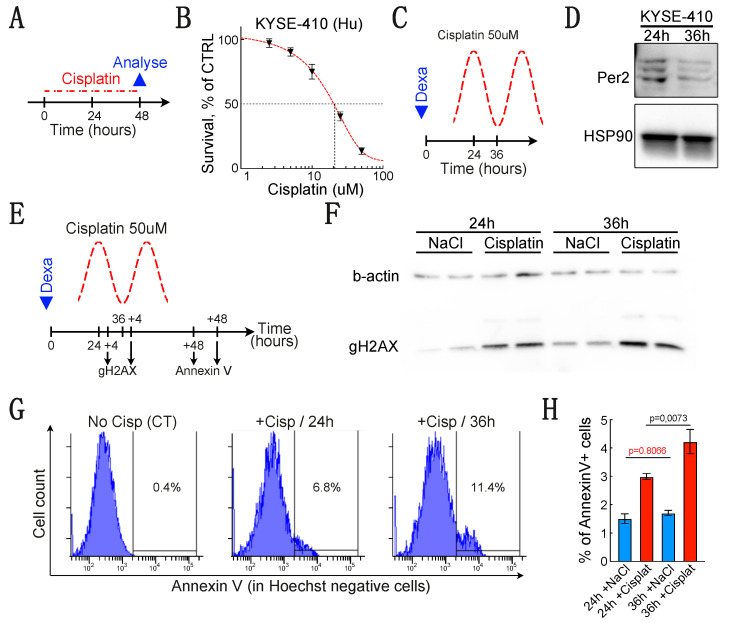
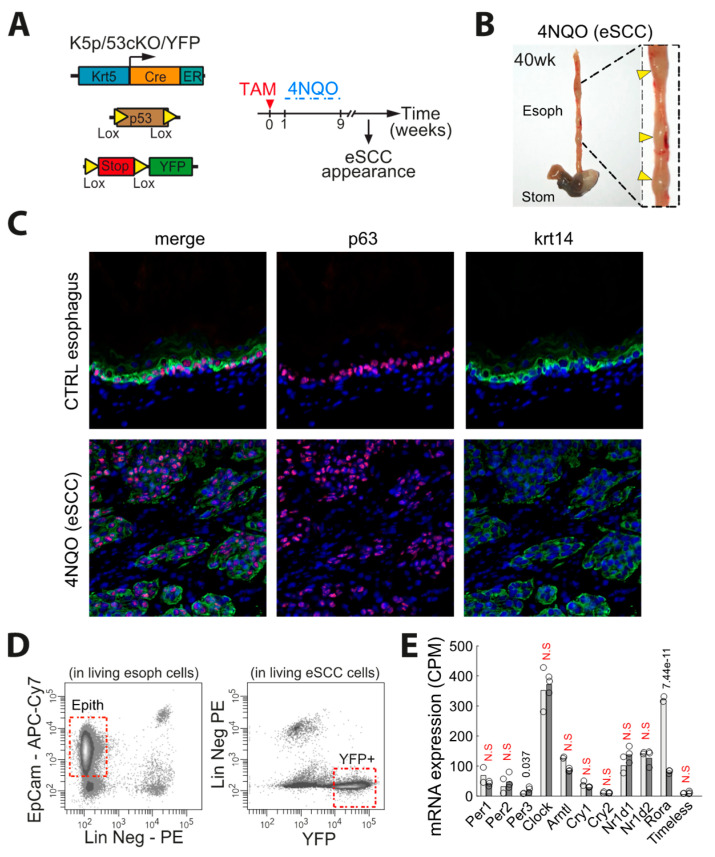
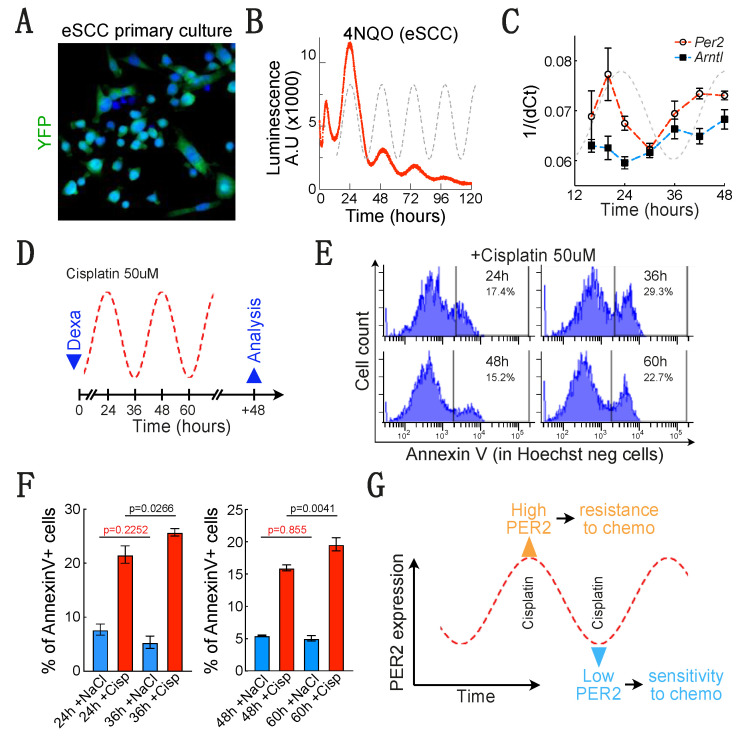
Esophageal squamous cell carcinoma (eSCC) accounts for more than 85% cases of esophageal cancer worldwide and the 5-year survival rate associated with metastatic eSCC is poor. This low survival rate is the consequence of a complex mechanism of resistance to therapy and tumor relapse. To effectively reduce the mortality rate of this disease, we need to better understand the molecular mechanisms underlying the development of resistance to therapy and translate that knowledge into novel approaches for cancer treatment. The circadian clock orchestrates several physiological processes through the establishment and synchronization of circadian rhythms. Since cancer cells need to fuel rapid proliferation and increased metabolic demands, the escape from circadian rhythm is relevant in tumorigenesis. Although clock related genes may be globally repressed in human eSCC samples, PER2 expression still oscillates in some human eSCC cell lines. However, the consequences of this circadian rhythm are still unclear. In the present study, we confirm that PER2 oscillations still occur in human cancer cells in vitro in spite of a deregulated circadian clock gene expression. Profiling of eSCC cells by RNAseq reveals that when PER2 expression is low, several transcripts related to apoptosis are upregulated. Consistently, treating eSCC cells with cisplatin when PER2 expression is low enhances DNA damage and leads to a higher apoptosis rate. Interestingly, this process is conserved in a mouse model of chemically-induced eSCC ex vivo. These results therefore suggest that response to therapy might be enhanced in esophageal cancers using chronotherapy.

Keywords: apoptosis; chemotherapy; chronotherapy; circadian clock; esophagus cancer; squamous cell carcinoma.


Conflict of interest statement

The authors declare no conflict of interest.

Figures

Figure 1
Figure 1
Expression of clock-related genes in human esophageal squamous cell carcinoma (eSCC) samples. (A) Expression of clock related genes measured by RNA sequencing in biopsies from control esophagus (n = 11) and eSCC (n = 95). Data are represented as boxplots. False discovery rate (FDR) is indicated for each gene. Benjamini–Hochberg method on the p-values was used to control the FDR. (B) Expression of clock related genes measured by RNA sequencing in biopsies from eSCC samples depending on their pathological stage. Data are represented as boxplots. Statistics were calculated using a Kruskal–Wallis test followed by a Tukey–Kramer test. p-values < 0.05 are considered as significant.
Figure 2
Figure 2
PER2 expression oscillates in human eSCC cells in spite of alterations in the pattern of clock-related gene expression. (A) Experimental design. (B) Histogram depicting the expression of clock related genes measured by RNA sequencing in the KYSE-140 human eSCC cell line. Data are represented as the mean of a biological duplicate. FDR is indicated for each gene. Benjamini–Hochberg method on the p-values was used to control the false discovery rate (FDR). (C) Same as in (B) in the KYSE-180 human eSCC cell line. (D) Same as in (B) in the KYSE-270 human eSCC cell line. (E) Same as in (B) in the KYSE-410 human eSCC cell line. (F) Same as in (B) in the KYSE-450 human eSCC cell line. (G) Co-immunostaining of p63 and Krt14 in the KYSE-410 human eSCC cell line. (H) Experimental design to monitor the activity of the PER2 promotor in KYSE-410 cells. (I) Real time monitoring of luciferase activity in the KYSE-410 human eSCC cell line. FDR>5% are considered non-significant (N.S).
Figure 3
Figure 3
PER2 expression oscillations are associated to modifications of the transcriptome. (A) Experimental design. (B) Volcano plots representing results of RNA-seq as the statistical significance versus the magnitude of fold of change (FC) in KYSE-410 compared to control esophageal cells. Data are filtered based on FC (abs(LFC) > 1) and p-value (p < 0.05). (C) Gene set enrichment analysis (GSEA) of the significantly modified transcripts in KYSE-410 cells compared to control esophageal cells (abs(LFC) > 1, p-value < 0.05). (D) Table summarizing the results of the GSEA. Pathways with a p-value < 0.05 are listed and sorted based on normalized enrichment score.
Figure 4
Figure 4
A low PER2 expression is associated to higher sensitivity to cisplatin-induced apoptosis. (A) Experimental design. (B) KYSE-410 survival measured using MTS assay 48 h after cisplatin treatment. The red sigmoid curve is a guide for the eye. Data are represented as mean +/− SEM (n = 5). (C) Experimental design to treat KYSE-410 when PER2 expression is high or low (24 or 36 h after synchronization respectively). (D) Western blot showing the expression of PER2 24 or 36 h after synchronization. (E) Schematic representation of the cisplatin treatment timeline and the time-points selected to collect the samples for DNA damage (γH2AX) evaluation and apoptosis (annexin V) measurement. (F) Western blot showing the expression of γH2AX after a 4-h cisplatin treatment either 24 or 36 h post-synchronization. Cells were either treated with vehicle alone (NaCl) or with 50 μM cisplatin. (G) Representative histogram showing the proportion of Hoechst-/Annexin V KYSE-410 cells measured by flow cytometry 48 h after the end of the cisplatin treatment. Cells were either not treated (NaCl = vehicle) or treated for 4 h with 50 μM cisplatin 24 or 36 h after synchronization. (H) Histogram summarizing the proportion of Hoechst-/Annexin V KYSE-410 cells measured 48h after the end of the cisplatin treatment. Data are represented as mean +/− SEM (n = 8). p-values were calculated using a two-way ANOVA followed by Sidak’s post hoc test. Fixed effect: Time/p = 0.0110; Cisplatin/p < 0.0001; Time x Cisplatin/p = 0.0527.
Figure 5
Figure 5
PER2 expression oscillates in primary culture of mouse eSCC cells and influences sensitivity to chemotherapy. (A) Genetic strategy and experimental design. (B) Representative picture of 4-NQO-induced eSCC in K5:p53:YFP mouse esophagus. (C) Co-immunostaining of p63 and Krt14 in normal esophagus and 4-NQO-induced eSCC. (D) FACS plot showing the expression of EpCam and lineage negative markers (CD45, CD31, and CD140a) in control esophageal cells, and YFP and lineage negative markers in 4-NQO-induced eSCC. (E) Expression of clock-related genes measured by RNA sequencing in FACS sorted Epcam+ normal esophagus epithelial cells (n = 2) and YFP+ 4-NQO-induced eSCC epithelial cells (n = 3). FDR is indicated for each gene. Benjamini–Hochberg method on the p-values was used to control the false discovery rate (FDR). FDR>5% are considered non-significant (N.S). “Epith” means epithelial cells.
Figure 6
Figure 6
A low PER2 expression is associated to a higher sensitivity to cisplatin in mouse eSCC epithelial cells. (A) Endogenous YFP fluorescence in primary culture of 4-NQO-induced eSCC epithelial cells. (B) Real time monitoring of luciferase activity in primary culture of 4-NQO-induced eSCC epithelial cells. (C) PER2 and Arntl expression on the 4-NQO induced eSCC epithelial cells measured by qPCR for 48 h after dexamethasone-induced synchronization. (D) Experimental design to treat 4-NQO-induced eSCC epithelial cells when PER2 expression is high or low (24 or 36 h after dexamethasone-induced synchronization). (E) Representative histogram showing the proportion of Hoechst-/Annexin V 4-NQO-induced eSCC epithelial cells measured by flow cytometry 48 h after the end of the cisplatin treatment. Cells were either not treated (NaCl = vehicle) or treated for 4 h with 50 μM cisplatin 24, 36, 48 or 60 h after synchronization. (F) Histogram summarizing the proportion of Hoechst-/Annexin V+ 4-NQO-induced eSCC epithelial cells measured 48 h after the end of the cisplatin treatment. Data are represented as mean +/− SEM. p-values were calculated using a two-way ANOVA followed by Sidak’s post hoc test. First cycle (n = 8). Fixed effect: Time/p = 0.3788; Cisplatin/p < 0.0001; Time x Cisplatin/p = 0.0067. Second cycle (n = 5). Fixed effect: Time/p = 0.0231; Cisplatin/p < 0.0001; Time x Cisplatin/p = 0.0231. (G) Scheme depicting our main observations in esophageal cancer cells.

Similar articles

Cited by

References

    1. Delaunay F., Laudet V. Circadian Clock and Microarrays: Mammalian Genome Gets Rhythm. Trends Genet. 2002;18:595–597. doi: 10.1016/S0168-9525(02)02794-4. - DOI - PubMed
    1. Panda S., Antoch M.P., Miller B.H., Su A.I., Schook A.B., Straume M., Schultz P.G., Kay S.A., Takahashi J.S., Hogenesch J.B. Coordinated Transcription of Key Pathways in the Mouse by the Circadian Clock. Cell. 2002;109:307–320. doi: 10.1016/S0092-8674(02)00722-5. - DOI - PubMed
    1. Takahashi J.S. Transcriptional Architecture of the Mammalian Circadian Clock. Nat. Rev. Genet. 2017;18:164–179. doi: 10.1038/nrg.2016.150. - DOI - PMC - PubMed
    1. Kim P., Oster H., Lehnert H., Schmid S.M., Salamat N., Barclay J.L., Maronde E., Inder W., Rawashdeh O. Coupling the Circadian Clock to Homeostasis: The Role of Period in Timing Physiology. Endocr. Rev. 2019;40:66–95. doi: 10.1210/er.2018-00049. - DOI - PubMed
    1. Zhang R., Lahens N.F., Ballance H.I., Hughes M.E., Hogenesch J.B. A Circadian Gene Expression Atlas in Mammals: Implications for Biology and Medicine. Proc. Natl. Acad. Sci. USA. 2014;111:16219–16224. doi: 10.1073/pnas.1408886111. - DOI - PMC - PubMed

LinkOut - more resources