Randomized Controlled Trial
. 2021 Jul;78(1):38-47.
doi: 10.1053/j.ajkd.2020.10.015. Epub 2021 Mar 31.

Effect of Bicarbonate on Net Acid Excretion, Blood Pressure, and Metabolism in Patients With and Without CKD: The Acid Base Compensation in CKD Study

Affiliations
Randomized Controlled Trial

Effect of Bicarbonate on Net Acid Excretion, Blood Pressure, and Metabolism in Patients With and Without CKD: The Acid Base Compensation in CKD Study

Crystal C Tyson et al. Am J Kidney Dis. 2021 Jul.

Abstract

Rationale & objective: Patients with CKD are at elevated risk of metabolic acidosis due to impaired net acid excretion (NAE). Identifying early markers of acidosis may guide prevention in chronic kidney disease (CKD). This study compared NAE in participants with and without CKD, as well as the NAE, blood pressure (BP), and metabolomic response to bicarbonate supplementation.

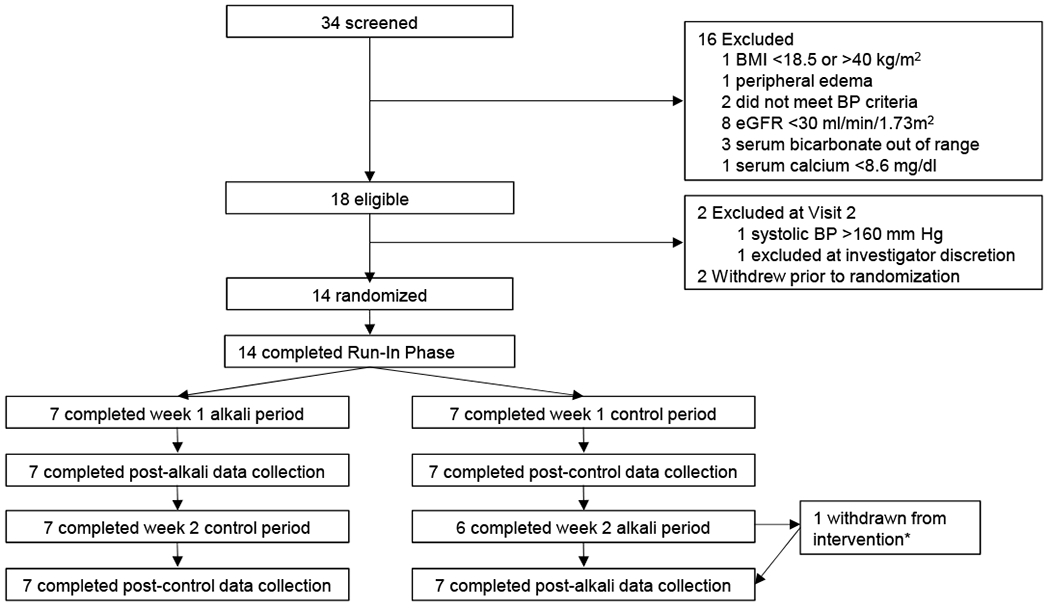
Study design: Randomized order, cross-over study with controlled feeding.

Setting & participants: Participants consisted of 8 patients with CKD (estimated glomerular filtration rate 30-59mL/min/1.73m2 or 60-70mL/min/1.73m2 with albuminuria) and 6 patients without CKD. All participants had baseline serum bicarbonate concentrations between 20 and 28 mEq/L; they did not have diabetes mellitus and did not use alkali supplements at baseline.

Intervention: Participants were fed a fixed-acid-load diet with bicarbonate supplementation (7 days) and with sodium chloride control (7 days) in a randomized order, cross-over fashion.

Outcomes: Urine NAE, 24-hour ambulatory BP, and 24-hour urine and plasma metabolomic profiles were measured after each period.

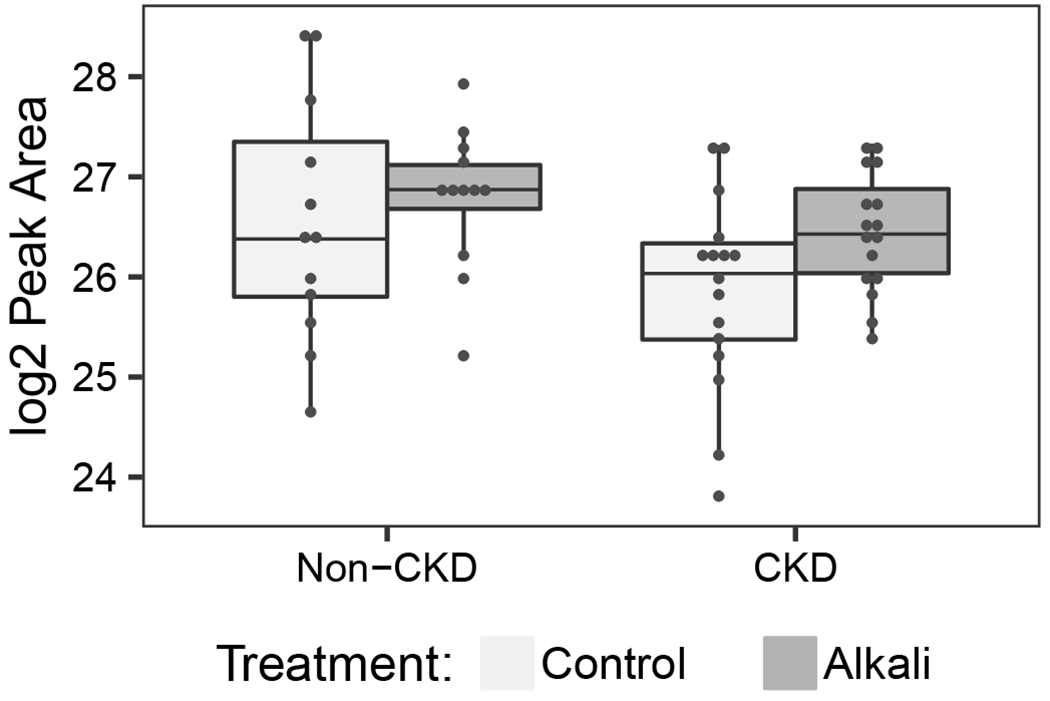
Results: During the control period, mean NAE was 28.3±10.2 mEq/d overall without differences across groups (P=0.5). Urine pH, ammonium, and citrate were significantly lower in CKD than in non-CKD (P<0.05 for each). Bicarbonate supplementation reduced NAE and urine ammonium in the CKD group, increased urine pH in both groups (but more in patients with CKD than in those without), and increased; urine citrate in the CKD group (P< 0.2 for interaction for each). Metabolomic analysis revealed several urine organic anions were increased with bicarbonate in CKD, including 3-indoleacetate, citrate/isocitrate, and glutarate. BP was not significantly changed.

Limitations: Small sample size and short feeding duration.

Conclusions: Compared to patients without CKD, those with CKD had lower acid excretion in the form of ammonium but also lower base excretion such as citrate and other organic anions, a potential compensation to preserve acid-base homeostasis. In CKD, acid excretion decreased further, but base excretion (eg, citrate) increased in response to alkali. Urine citrate should be evaluated as an early and responsive marker of impaired acid-base homeostasis.

Funding: National Institute of Diabetes and Digestive and Kidney Diseases and the Duke O'Brien Center for Kidney Research.

Trial registration: Registered at ClinicalTrials.gov with study number NCT02427594.

Keywords: CKD; NAE; acid-base homeostasis; alkali; bicarbonate; bicarbonate supplementation; chronic kidney disease; cross-over trial; diet; human feeding study; hypertension; metabolic acidosis; net acid excretion; subclinical acidosis.


Figures

Figure 1.
Figure 1.
Flow of participants beginning on in-person screening visits through protocol completion. *withdrawn from treatment on day 6 of 7 day alkali period due to hyponatremia. Abbreviations: BMI, body mass index; BP, blood pressure.
Figure 2.
Figure 2.. Change in urine acidity markers comparing the end of the second week to the end of the first week in each ABC participant.
Points on the X-axis represent individual measurements within 14 participants (all); 8 individuals with chronic kidney disease (CKD) are represented by closed circles (•) and 6 individuals without CKD are represented by open circles (ο), arranged in order of pre-post change. Left sided panels represent individuals who were randomized to the control period first followed by the alkali period. Negative values in the left panels represent lower values in the alkali period. Right sided panels represent individuals who were randomized to the alkali period first followed by the control period. Positive values in the right panels represent lower values in the alkali period. Approximate symmetry represents an absence of order effects for all analytes except citrate, in which an order effect is possible.
Figure 3.
Figure 3.. Levels of selected metabolites impacted by alkali depicted by study period and CKD status in the ABC Study.
Metabolites supported by both linear mixed models and sparse partial least squares discriminant analysis are presented. Scatterplots with overlying boxplots reveal log2 peak areas according to alkali and control periods in CKD and non-CKD for each of the following: (A) 24-hour urine 3-indoleacetate; (B) 24-hour urine citrate/isocitrate; (C) 24-hour urine glutarate. These metabolites were present in each sample tested and did not require imputation.

References

    1. Workeneh BT, Mitch WE. Review of muscle wasting associated with chronic kidney disease. Am J Clin Nutr. 2010;91(4):1128S–1132S. - PubMed
    1. Shah SN, Abramowitz M, Hostetter TH, Melamed ML. Serum bicarbonate levels and the progression of kidney disease: a cohort study. Am J Kidney Dis. 2009;54(2):270–277. - PMC - PubMed
    1. Kovesdy CP, Anderson JE, Kalantar-Zadeh K. Association of serum bicarbonate levels with mortality in patients with non-dialysis-dependent CKD. Nephrol Dial Transplant. 2009;24(4):1232–1237. - PMC - PubMed
    1. Navaneethan SD, Schold JD, Arrigain S, et al. Serum bicarbonate and mortality in stage 3 and stage 4 chronic kidney disease. Clin J Am Soc Nephrol. 2011;6(10):2395–2402. - PMC - PubMed
    1. Abramowitz MK, Melamed ML, Bauer C, Raff AC, Hostetter TH. Effects of oral sodium bicarbonate in patients with CKD. Clin J Am Soc Nephrol. 2013;8(5):714–720. - PMC - PubMed

Publication types

Associated data