

Animal welfare risks of global aquaculture
- PMID: 33811081
- PMCID: PMC11057778
- DOI: 10.1126/sciadv.abg0677
Animal welfare risks of global aquaculture
Abstract
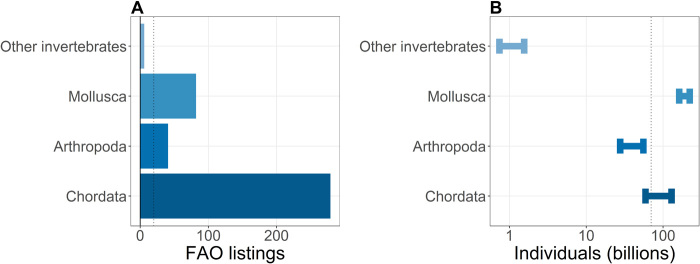
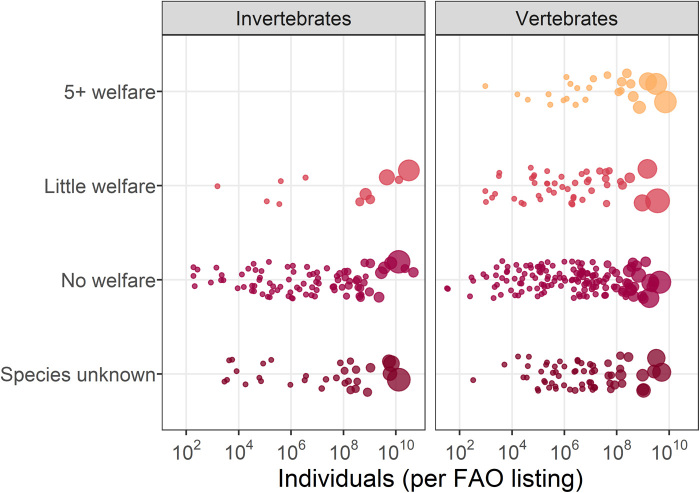
The unprecedented growth of aquaculture involves well-documented environmental and public-health costs, but less is understood about global animal welfare risks. Integrating data from multiple sources, we estimated the taxonomic diversity of farmed aquatic animals, the number of individuals killed annually, and the species-specific welfare knowledge (absence of which indicates extreme risk). In 2018, FAO reported 82.12 million metric tons of farmed aquatic animals from six phyla and at least 408 species-20 times the number of species of farmed terrestrial animals. The farmed aquatic animal tonnage represents 250 to 408 billion individuals, of which 59 to 129 billion are vertebrates (e.g., carps, salmonids). Specialized welfare information was available for 84 species, only 30% of individuals; the remaining 70% either had no welfare publications or were of an unknown species. With aquaculture growth outpacing welfare knowledge, immediate efforts are needed to safeguard the welfare of high-production, understudied species and to create policies that minimize welfare risks.
Copyright © 2021 The Authors, some rights reserved; exclusive licensee American Association for the Advancement of Science. No claim to original U.S. Government Works. Distributed under a Creative Commons Attribution NonCommercial License 4.0 (CC BY-NC).
Figures
References
-
- FAO, The State of World Fisheries and Aquaculture - Meeting the Sustainable Development Goals (FAO, 2018).
-
- T. Searchinger, R. Waite, T. Beringer, A. Forslund, H. Guyomard, C. Le Mouël, S. Manceron, E. Marajo-Petitzon, World Resources Report: Creating a Sustainable Food Future (World Resources Institue, 2018), p. 96.
-
- Pauly D., Christensen V., Guénette S., Pitcher T. J., Sumaila U. R., Walters C. J., Watson R., Zeller D., Towards sustainability in world fisheries. Nature 418, 689–695 (2002). - PubMed
-
- Duarte C. M., Holmer M., Olsen Y., Soto D., Marbà N., Guiu J., Black K., Karakassis I., Will the oceans help feed humanity? Bioscience 59, 967–976 (2009).
-
- Longo S. B., Clarak B., York R., Jorgenson A. K., Aquaculture and the displacement of fisheries captures. Conserv. Biol. 33, 832–841 (2019). - PubMed
Publication types
MeSH terms
LinkOut - more resources
Full Text Sources
Other Literature Sources
