

The Human Brain Encodes a Chronicle of Visual Events at Each Instant of Time Through the Multiplexing of Traveling Waves
- PMID: 33811150
- PMCID: PMC8387111
- DOI: 10.1523/JNEUROSCI.2098-20.2021
The Human Brain Encodes a Chronicle of Visual Events at Each Instant of Time Through the Multiplexing of Traveling Waves
Abstract
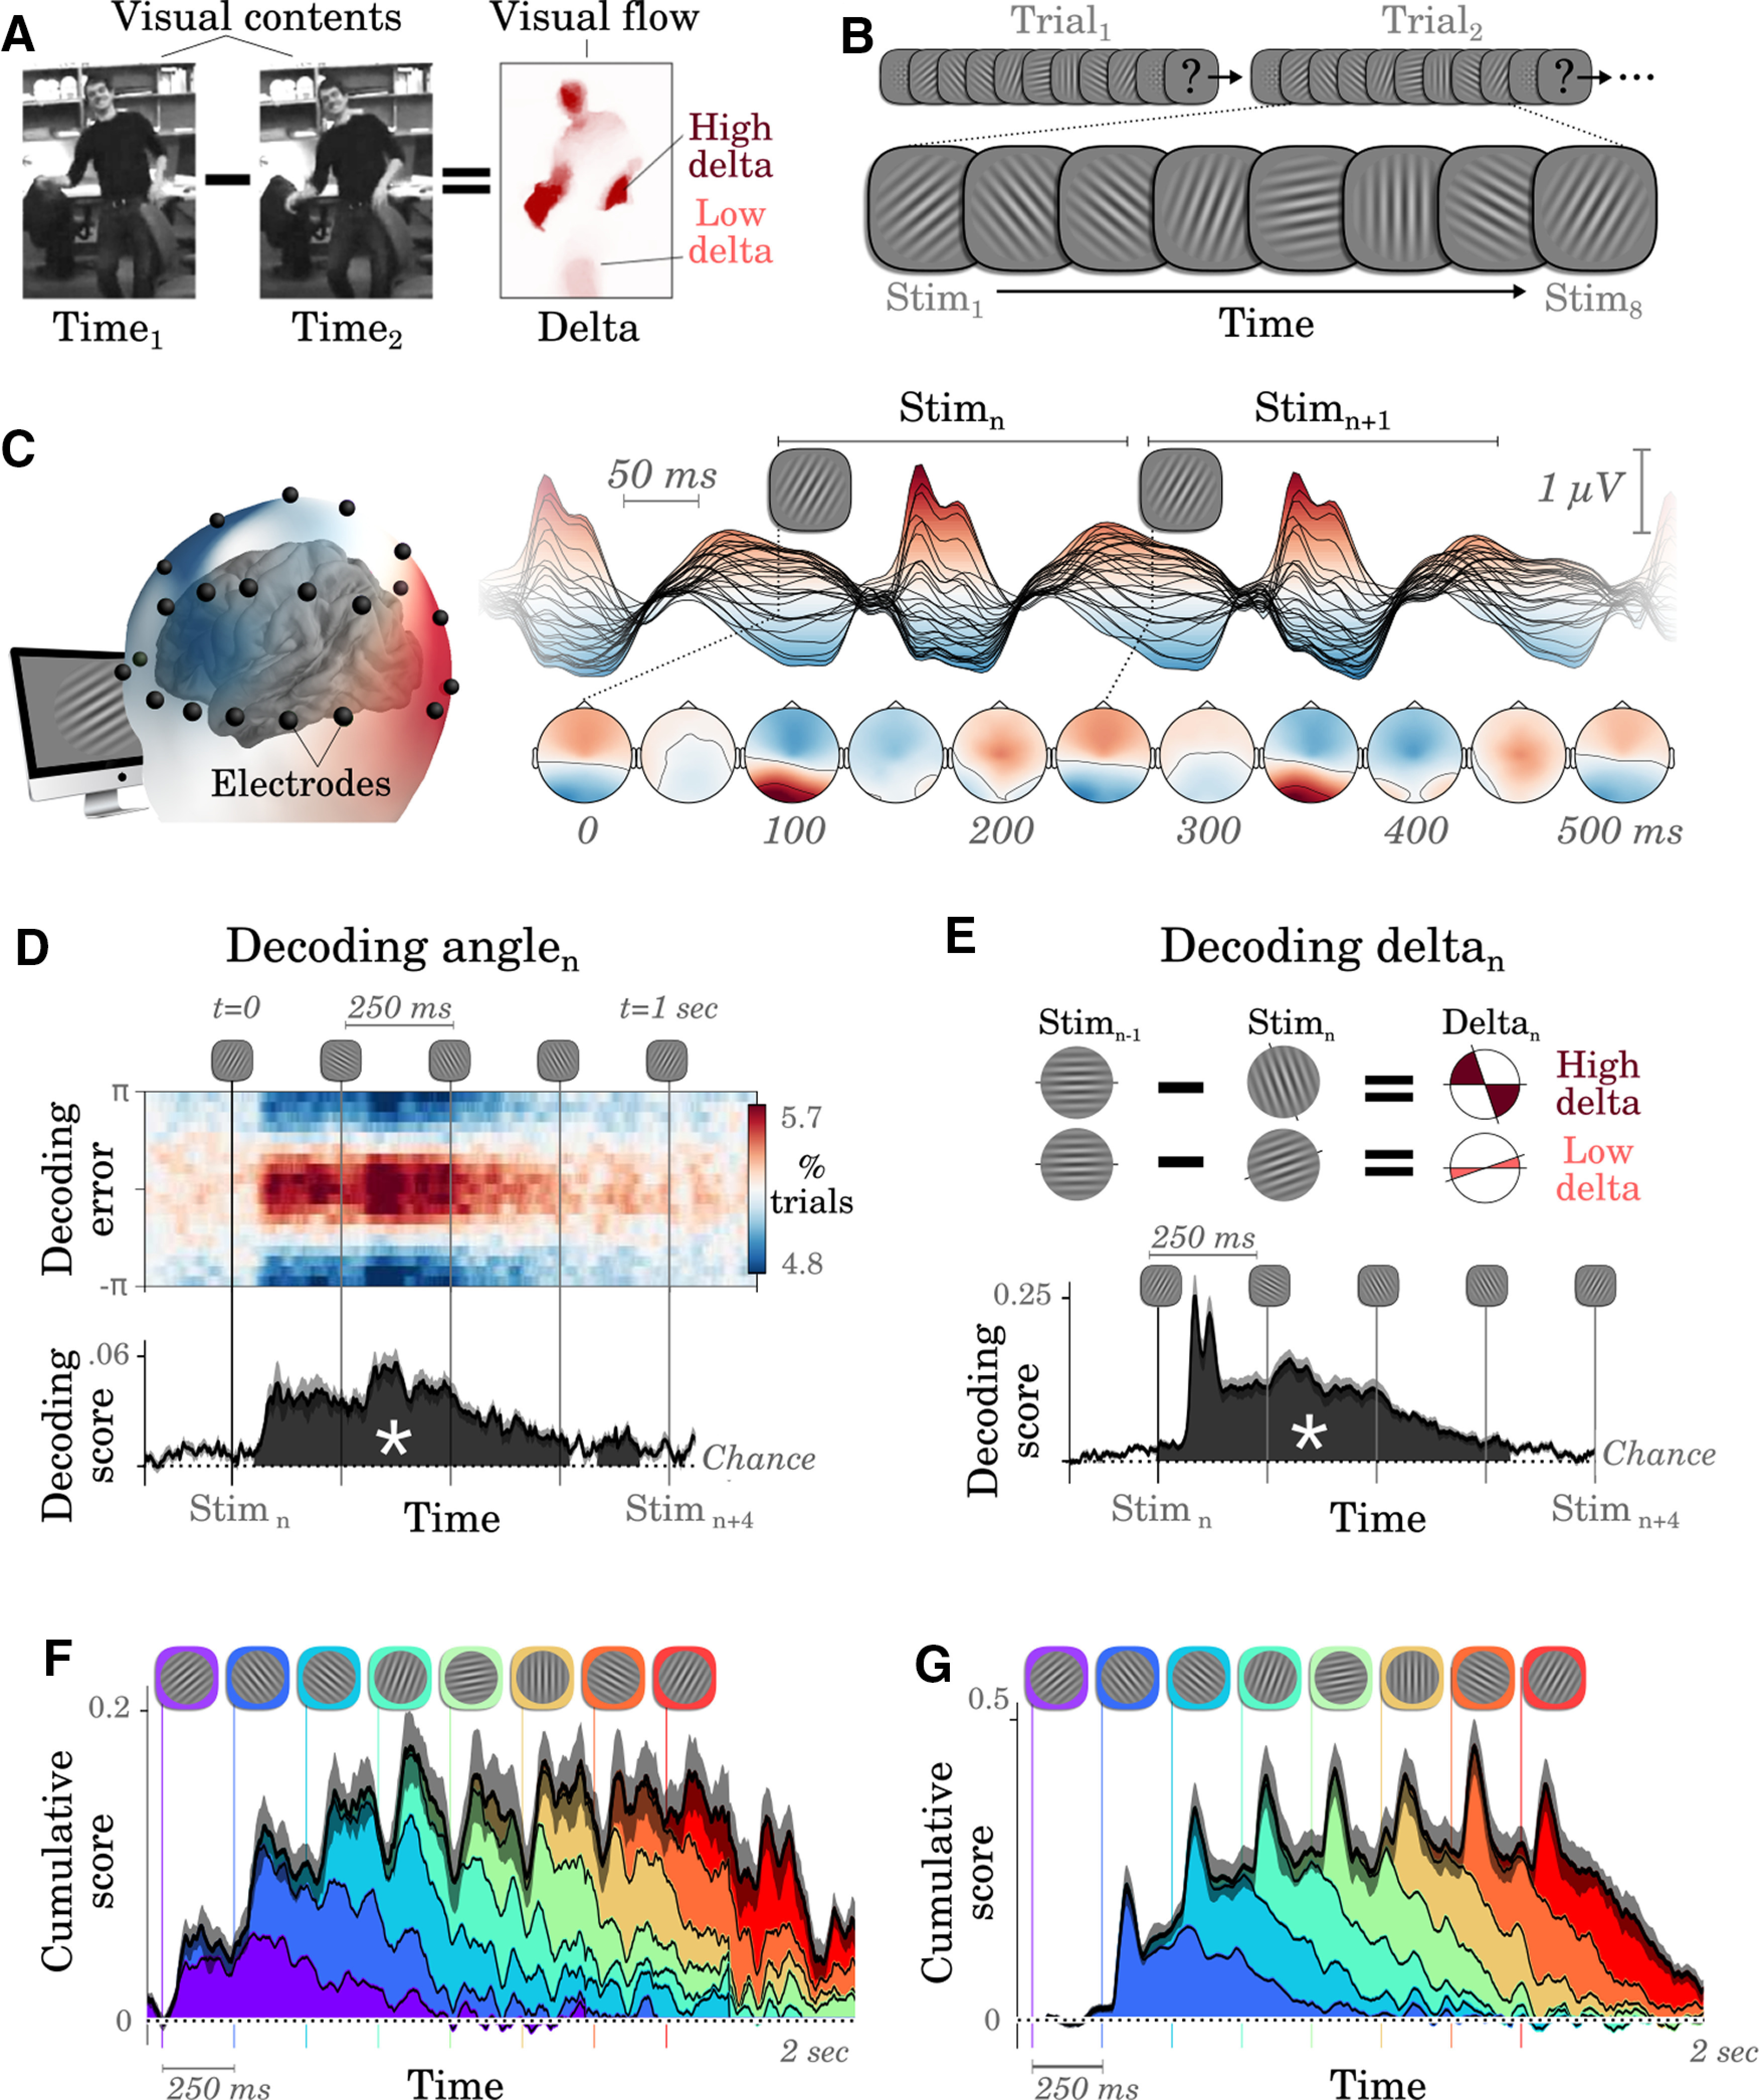
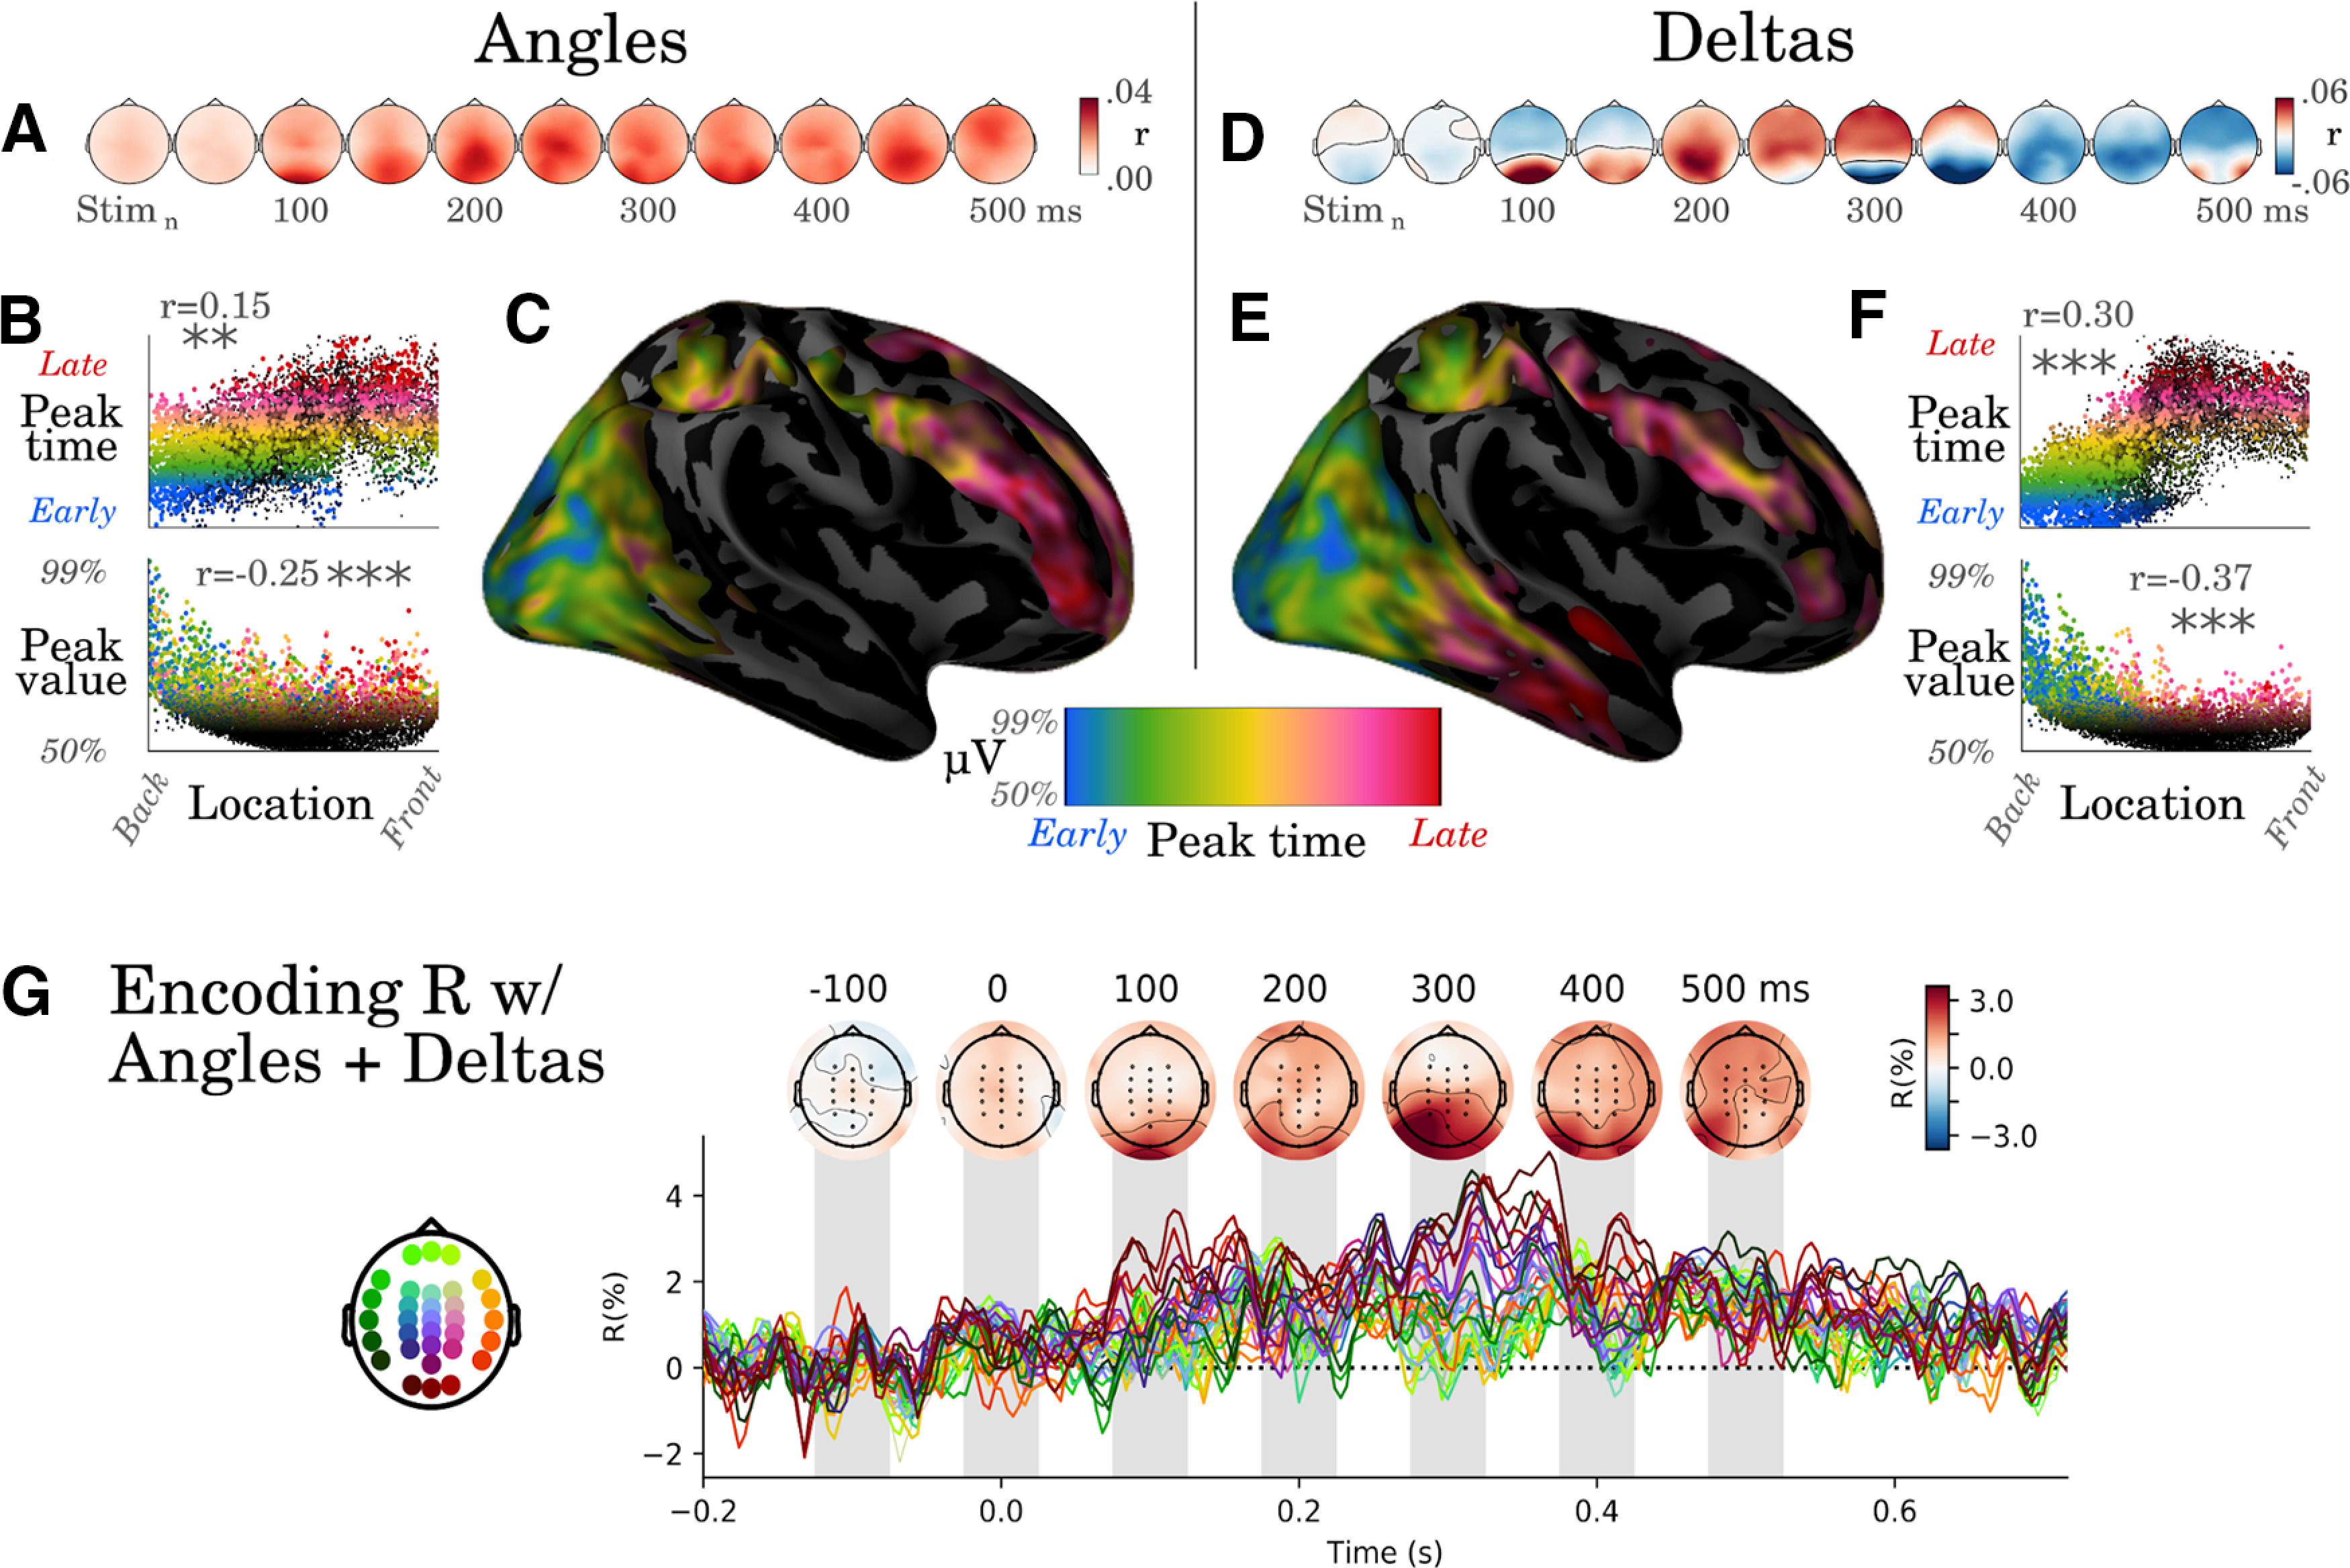
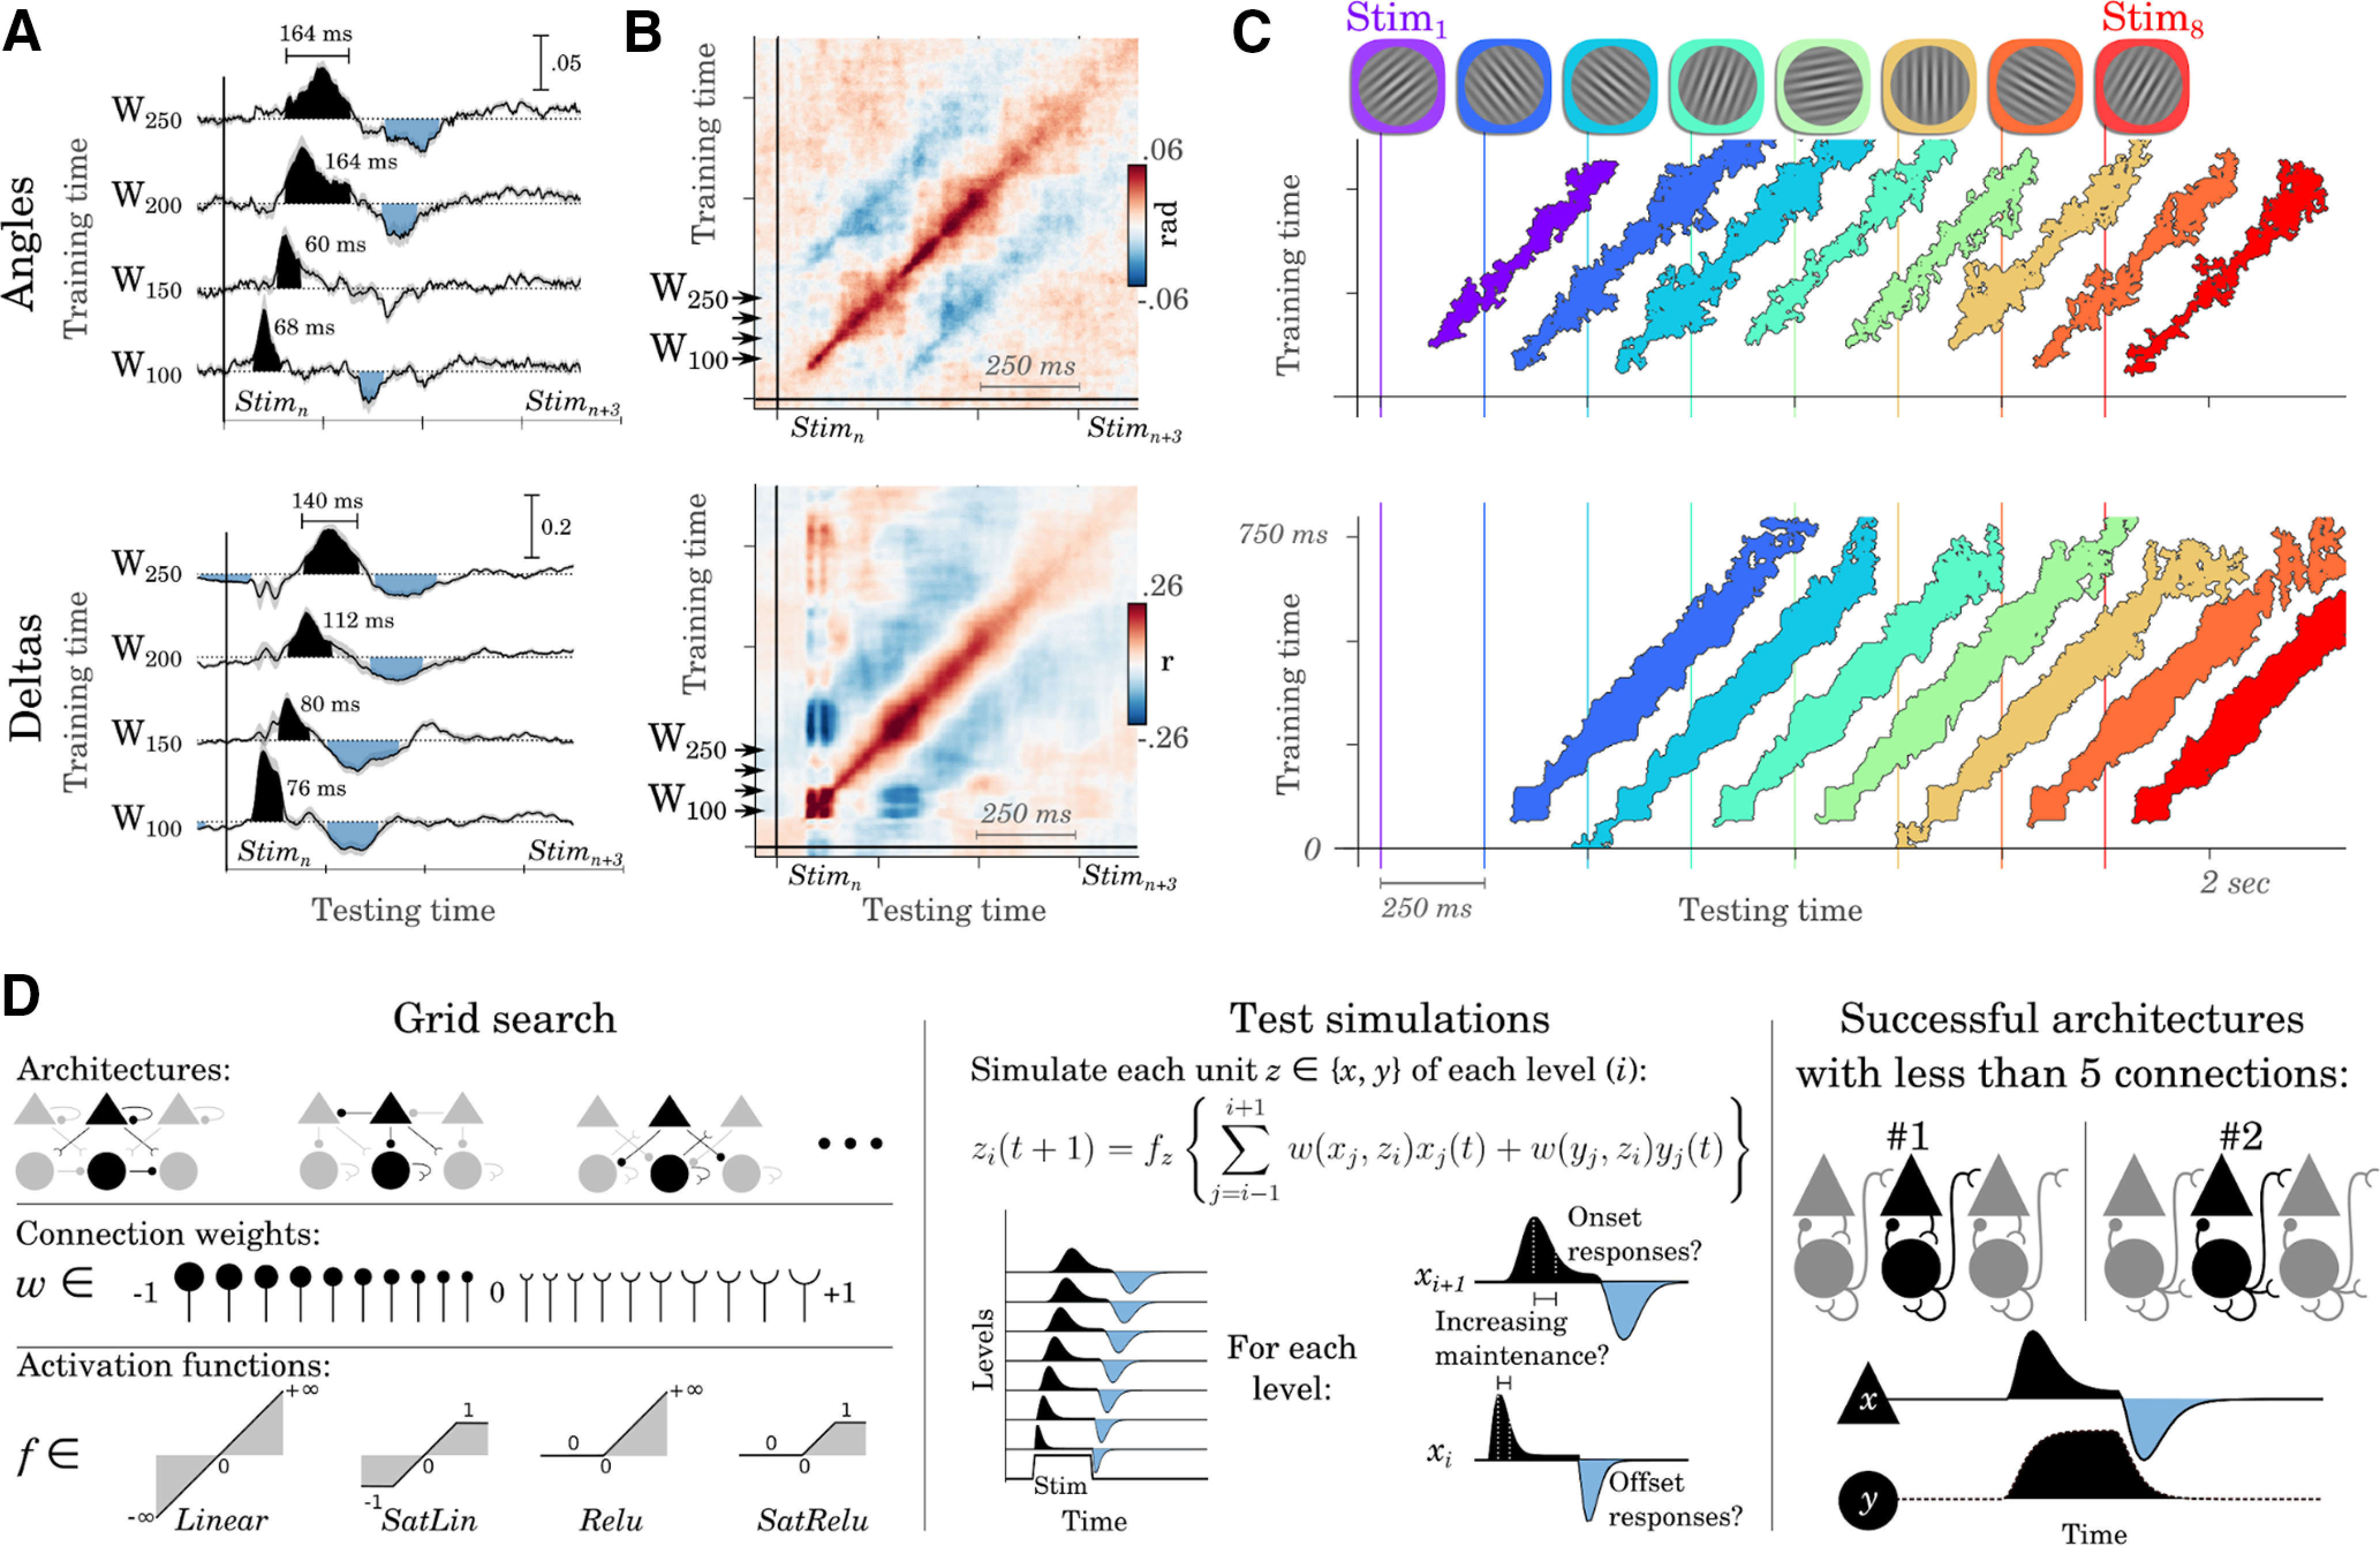
The human brain continuously processes streams of visual input. Yet, a single image typically triggers neural responses that extend beyond 1s. To understand how the brain encodes and maintains successive images, we analyzed with electroencephalography the brain activity of human subjects while they watched ∼5000 visual stimuli presented in fast sequences. First, we confirm that each stimulus can be decoded from brain activity for ∼1s, and we demonstrate that the brain simultaneously represents multiple images at each time instant. Second, we source localize the corresponding brain responses in the expected visual hierarchy and show that distinct brain regions represent, at each time instant, different snapshots of past stimulations. Third, we propose a simple framework to further characterize the dynamical system of these traveling waves. Our results show that a chain of neural circuits, which each consist of (1) a hidden maintenance mechanism and (2) an observable update mechanism, accounts for the dynamics of macroscopic brain representations elicited by visual sequences. Together, these results detail a simple architecture explaining how successive visual events and their respective timings can be simultaneously represented in the brain.SIGNIFICANCE STATEMENT Our retinas are continuously bombarded with a rich flux of visual input. Yet, how our brain continuously processes such visual streams is a major challenge to neuroscience. Here, we developed techniques to decode and track, from human brain activity, multiple images flashed in rapid succession. Our results show that the brain simultaneously represents multiple successive images at each time instant by multiplexing them along a neural cascade. Dynamical modeling shows that these results can be explained by a hierarchy of neural assemblies that continuously propagate multiple visual contents. Overall, this study sheds new light on the biological basis of our visual experience.
Keywords: EEG; decoding; dynamical system; streams; time; visual perception.
Copyright © 2021 King and Wyart.
Figures

Comment in
-
Unraveling the Neural Mechanisms Which Encode Rapid Streams of Visual Input.J Neurosci. 2022 Feb 16;42(7):1170-1172. doi: 10.1523/JNEUROSCI.2013-21.2021. J Neurosci. 2022. PMID: 35173038 Free PMC article. No abstract available.
Similar articles
-
Suppressive Traveling Waves Shape Representations of Illusory Motion in Primary Visual Cortex of Awake Primate.J Neurosci. 2019 May 29;39(22):4282-4298. doi: 10.1523/JNEUROSCI.2792-18.2019. Epub 2019 Mar 18. J Neurosci. 2019. PMID: 30886010 Free PMC article.
-
Network structure and dynamics of the mental workspace.Proc Natl Acad Sci U S A. 2013 Oct 1;110(40):16277-82. doi: 10.1073/pnas.1311149110. Epub 2013 Sep 16. Proc Natl Acad Sci U S A. 2013. PMID: 24043842 Free PMC article.
-
Anticipation of temporally structured events in the brain.Elife. 2021 Apr 22;10:e64972. doi: 10.7554/eLife.64972. Elife. 2021. PMID: 33884953 Free PMC article.
-
Shared Neural Mechanisms of Visual Perception and Imagery.Trends Cogn Sci. 2019 May;23(5):423-434. doi: 10.1016/j.tics.2019.02.004. Epub 2019 Mar 12. Trends Cogn Sci. 2019. PMID: 30876729 Review.
-
Decoding the brain: From neural representations to mechanistic models.Cell. 2024 Oct 17;187(21):5814-5832. doi: 10.1016/j.cell.2024.08.051. Cell. 2024. PMID: 39423801 Review.
Cited by
-
Position representations of moving objects align with real-time position in the early visual response.Elife. 2023 Jan 19;12:e82424. doi: 10.7554/eLife.82424. Elife. 2023. PMID: 36656268 Free PMC article.
-
Dynamics of visual object coding within and across the hemispheres: Objects in the periphery.Sci Adv. 2025 Jan 3;11(1):eadq0889. doi: 10.1126/sciadv.adq0889. Epub 2025 Jan 1. Sci Adv. 2025. PMID: 39742491 Free PMC article.
-
Task-related modulation of event-related potentials does not reflect changes to sensory representations.Imaging Neurosci (Camb). 2024 Aug 8;2:imag-2-00266. doi: 10.1162/imag_a_00266. eCollection 2024. Imaging Neurosci (Camb). 2024. PMID: 40800348 Free PMC article.
-
Cortical traveling waves reflect state-dependent hierarchical sequencing of local regions in the human connectome network.Sci Rep. 2022 Jan 10;12(1):334. doi: 10.1038/s41598-021-04169-9. Sci Rep. 2022. PMID: 35013416 Free PMC article.
-
Premature commitment to uncertain decisions during human NMDA receptor hypofunction.Nat Commun. 2022 Jan 17;13(1):338. doi: 10.1038/s41467-021-27876-3. Nat Commun. 2022. PMID: 35039498 Free PMC article. Clinical Trial.
References
-
- Brainard DH (1997) The psychophysics toolbox. Spat Vis 10:433–436. - PubMed
Publication types
MeSH terms
LinkOut - more resources
Full Text Sources
Other Literature Sources
Miscellaneous