. 2021 Apr 20;118(16):e2022643118.
doi: 10.1073/pnas.2022643118.

SARS-CoV-2 induces double-stranded RNA-mediated innate immune responses in respiratory epithelial-derived cells and cardiomyocytes

Affiliations

SARS-CoV-2 induces double-stranded RNA-mediated innate immune responses in respiratory epithelial-derived cells and cardiomyocytes

Yize Li et al. Proc Natl Acad Sci U S A. .

Erratum in

Abstract

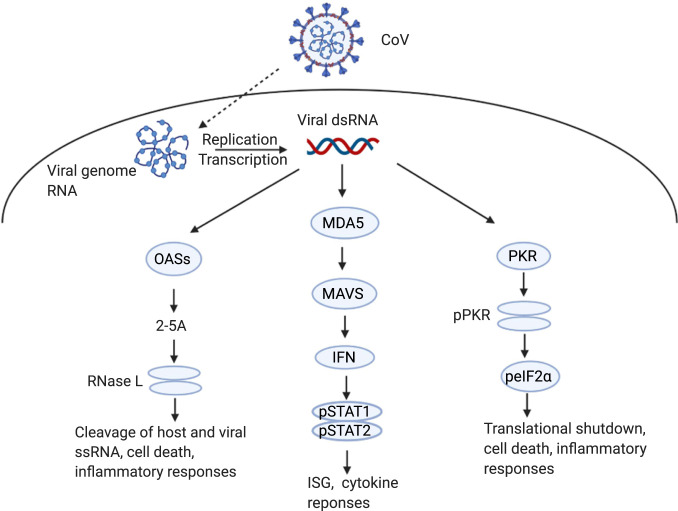
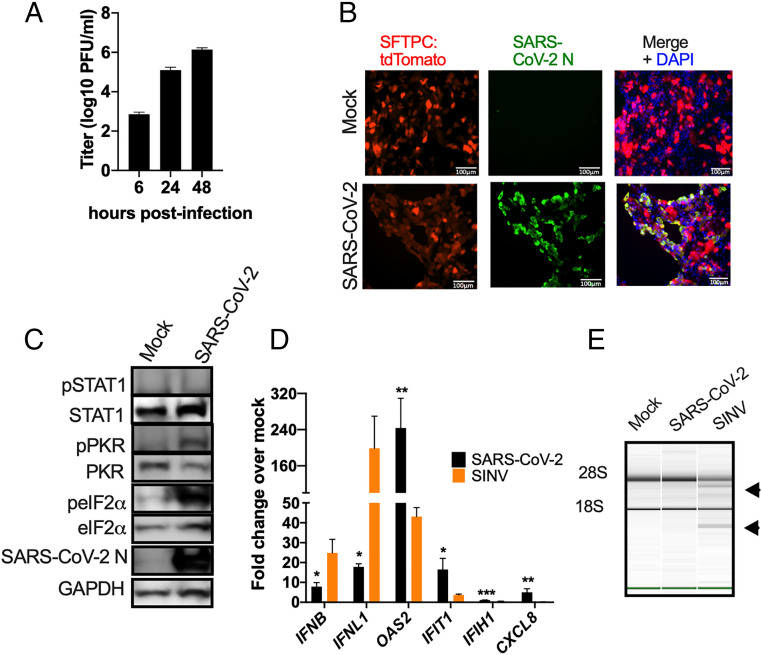
Coronaviruses are adept at evading host antiviral pathways induced by viral double-stranded RNA, including interferon (IFN) signaling, oligoadenylate synthetase-ribonuclease L (OAS-RNase L), and protein kinase R (PKR). While dysregulated or inadequate IFN responses have been associated with severe coronavirus infection, the extent to which the recently emerged SARS-CoV-2 activates or antagonizes these pathways is relatively unknown. We found that SARS-CoV-2 infects patient-derived nasal epithelial cells, present at the initial site of infection; induced pluripotent stem cell-derived alveolar type 2 cells (iAT2), the major cell type infected in the lung; and cardiomyocytes (iCM), consistent with cardiovascular consequences of COVID-19 disease. Robust activation of IFN or OAS-RNase L is not observed in these cell types, whereas PKR activation is evident in iAT2 and iCM. In SARS-CoV-2-infected Calu-3 and A549ACE2 lung-derived cell lines, IFN induction remains relatively weak; however, activation of OAS-RNase L and PKR is observed. This is in contrast to Middle East respiratory syndrome (MERS)-CoV, which effectively inhibits IFN signaling and OAS-RNase L and PKR pathways, but is similar to mutant MERS-CoV lacking innate immune antagonists. Remarkably, OAS-RNase L and PKR are activated in MAVS knockout A549ACE2 cells, demonstrating that SARS-CoV-2 can induce these host antiviral pathways despite minimal IFN production. Moreover, increased replication and cytopathic effect in RNASEL knockout A549ACE2 cells implicates OAS-RNase L in restricting SARS-CoV-2. Finally, while SARS-CoV-2 fails to antagonize these host defense pathways, which contrasts with other coronaviruses, the IFN signaling response is generally weak. These host-virus interactions may contribute to the unique pathogenesis of SARS-CoV-2.

Keywords: OAS-RNase L; PKR; SARS-CoV-2; interferon; interferon signaling genes.


Conflict of interest statement

Competing interest statement: S.R.W. is on the scientific advisory board of Immunome, Inc. and Ocugen, Inc. R.H.S. is a consultant to Cutherna, Inc.

Figures

Fig. 1.
Fig. 1.
dsRNA induced innate immune responses during coronavirus infection. Coronavirus dsRNA is recognized by cytosolic OAS, MDA5, or PKR to activate innate immune pathways. MDA5 signals through MAVS, leading to type I and type III IFN production and subsequent ISG transcription and cytokine responses. OASs produce 2-5A that activate RNase L, which cleaves host and viral ssRNA to trigger apoptosis and inflammation. PKR autophosphorylates before phosphorylating eIF2α, which leads to translational arrest, cell death, and inflammatory responses. Graphic was created with BioRender.com.
Fig. 2.
Fig. 2.
Infection of nasal epithelia-derived cells by SARS-CoV-2 and MERS-CoV. Nasal cells, cultured in air–liquid transwells, were mock-infected or infected apically with SARS-CoV-2 (multiplicity of infection, MOI = 5) and in (A) MERS-CoV (MOI = 5). (A) At indicated times, apically released virus was quantified by plaque assay on Vero-E6 cells. Values are means ± SD (error bars). Statistical significance (not displayed) was determined by two-way ANOVA (*P < 0.05). One experiment was performed using four separate donors. (B) At 48 hpi, nasal cells were fixed and permeabilized. N protein (red) of SARS-CoV-2 and MERS-CoV was detected with an anti-N antibody, and cilia (green) detected with an anti-type IV β-tubulin antibody by immunofluorescence assay (IFA). One representative image is shown from at least three independent experiments, with four donors for each virus infection. (Scale bars, 100 μm.) (C) At 120 hpi, cells were lysed, and proteins were analyzed by immunoblotting with antibodies as indicated. One experiment using three separate donors was performed. Cells from a fourth donor (#13) were mock-treated or treated with IFN-α (500 Units/mL) for 1 h before lysis and protein lysates from Calu-3 cells (mock or SARS-CoV-2; MOI = 5); infected Calu-3 cells 24 hpi were also analyzed. (D) At 120 hpi, total RNA was harvested, and mRNA expression level quantified by RT-qPCR. CT values were normalized to 18S rRNA and expressed as fold-change over mock displayed as 2−Δ(ΔCt). Technical replicates were averaged, the means for each replicate displayed, ±SD. One experiment was performed using three separate donor (#9, #10, #11) samples. (E) RNA was harvested from two donors at 120 hpi and rRNA integrity determined by Bioanalyzer. The position of 28S and 18S rRNA are indicated. Data shown are from one representative experiment of two independent experiments (SI Appendix, Figs. S1A and S2).
Fig. 3.
Fig. 3.
Infection of iAT2 cells by SARS-CoV-2. iAT2 cells were mock-infected or infected with SARS-CoV-2 (MOI = 5) or for (D and E) SINV (MOI = 1). (A) At indicated times, supernatants were collected and infectious virus was quantified by plaque assay on Vero-E6 cells. Values are means ± SD (error bars). Data shown are one representative experiment from at least three independent experiments. (B) At 48 hpi, cells were fixed and permeabilized. Expression of N protein (green) of SARS-CoV-2 and the expression of SFTPC promoter control tdTomato fluorescent protein (AT2 marker in red) was examined by IFA. Channels are merged with DAPI nuclear staining. Images shown are representative from at least three independent experiments. (Scale bars, 100 μm.) (C) At 48 hpi, cells were lysed and proteins were analyzed by immunoblotting with antibodies as indicated. Data shown are from one representative experiment of two independent experiments. (D) At 16 (SINV) or 48 (SARS-CoV-2) hpi, total RNA was harvested, and the mRNA expression level was quantified by RT-qPCR. CT values were normalized to 18S rRNA and expressed as fold-change over mock displayed as 2−Δ(ΔCt). Technical replicates were averaged and the means displayed, ±SD. Statistical significance was determined by Student t test (*P < 0.05; **P < 0.01; ***P < 0.001). Data shown are from one representative experiment of two independent experiments. (E) Total RNA was harvested at 16 (SINV) or 48 (SARS-CoV-2) hpi and rRNA integrity determined by Bioanalyzer. The position of 28S and 18S rRNA and indicated. Data shown are from one representative experiment of two independent experiments (SI Appendix, Figs. S1 B and D and S2).
Fig. 4.
Fig. 4.
Infection of iCM by SARS-CoV-2. iCM were mock-infected or infected with SARS-CoV-2 or, for C–E, SINV (MOI = 1). (A) At indicated times, supernatants were collected and virus quantified by plaque assay on Vero-E6 cells. Values are means ± SD. Data are one representative experiment from at least three independent experiments. (B) At 48 hpi, iCM were fixed and permeabilized, the expression of SARS-CoV-2 N (green) of and of cTnT protein (red) was examined by IFA. Channels are merged with DAPI nuclear staining. Images shown are representative of three independent experiments. (Scale bars, 50 μm.) (C) At 16 (SINV) or 48 (SARS-CoV-2) hpi, cells were lysed and proteins were analyzed by immunoblotting with antibodies as indicated. Immunoblots were performed at least two times and one representative blot is shown. (D) At 16 (SINV) or 48 (SARS-CoV-2) hpi, total RNA was harvested, the mRNA expression levels were quantified by RT-qPCR. CT values were normalized to 18S rRNA and expressed as fold-change over mock displayed as 2−Δ(ΔCt). Technical replicates were averaged, the means for each replicate displayed, ±SD (error bars). Statistical significance was determined by Student t test (*P < 0.05; ****P < 0.0001; ns = not significant). Data are from one representative experiment of two independent experiments. (E) Total RNA was harvested at 16 (SINV) or 48 (SARS-CoV-2) hpi, and rRNA integrity determined by Bioanalyzer. The position of 28S and 18S rRNA and indicated. Data shown are from one representative experiment of two independent experiments (SI Appendix, Figs. S1 C and D and S2).
Fig. 5.
Fig. 5.
SARS-CoV-2 IFN responses in A549ACE2 cell line. A549ACE2 cells (clone 44) were mock-infected or infected with SARS-CoV-2 (MOI = 5) or, for A, SINV (MOI = 1). (A) Total RNA was harvested at 24 and 48 hpi and mRNA expression was quantified by RT-qPCR. CT values were normalized to 18S rRNA and expressed as fold-change over mock displayed as 2−Δ(ΔCt). Technical replicates were averaged, the means for each replicate displayed, ±SD (error bars). (B) Viral genome copies per ug of total RNA were calculated at 24 and 48 hpi by RT-qPCR standard curve. Values are means ± SD (error bars). Statistical significance was determined by one-way ANOVA (*P < 0.05; **P < 0.01; ***P < 0.001; ****P < 0.0001; ns = not significant) (SI Appendix, Figs. S2–S4).
Fig. 6.
Fig. 6.
SARS-CoV-2 and MERS-CoV IFN responses in the lung-derived Calu-3 cells. Calu-3 cells were mock-treated or infected with SARS-CoV-2, MERS-CoV, or MERS-CoV-ΔNS4ab (MOI = 5). (A) At 24 or 48 hpi, total RNA was harvested and expression of mRNA was quantified by RT-qPCR. CT values were normalized to 18S rRNA and expressed as fold-change over mock displayed as 2−Δ(ΔCt). Technical replicates were averaged, the means for each replicate displayed, ±SD (error bars). Statistical significance was determined by two-way ANOVA (*P < 0.05; **P < 0.01; ***P < 0.001; ****P < 0.0001; ns = not significant). (B) Viral genome copies per microgram of total RNA were calculated by RT-qPCR standard curve generated using a digested plasmid encoding SARS-CoV-2 nsp12 or plasmid encoding a region of MERS-CoV orf1ab. Values are means ± SD (error bars). Statistical significance was determined by two-way ANOVA (*P < 0.05; **P < 0.01; ns = not significant). (C) At 24 hpi, Calu-3 cells were lysed and proteins harvested. Proteins were analyzed by immunoblotting using the indicated antibodies. All data are one representative experiment of three independent experiments (SI Appendix, Figs. S2 and S3).
Fig. 7.
Fig. 7.
SARS-CoV-2 infection leads to activation of RNase L and PKR in A549ACE2 and Calu-3 cells. A549ACE2 and Calu-3 cells were mock-infected or infected with SARS-CoV-2, MERS-CoV, or MERS-CoV-ΔNS4ab (MOI = 5). Total RNA was harvested from A549ACE2 cells (A) or Calu-3 cells (B) at 24 and 48 hpi. rRNA integrity was assessed by Bioanalyzer. 28S and 18S rRNA bands are indicated. At 24 hpi, A549ACE2 cells (C) or Calu-3 cells (D) were lysed and proteins harvested for analysis by immunoblotting using the indicated antibodies. All data are one representative experiment of three independent experiments (SI Appendix, Fig. S4 D and E).
Fig. 8.
Fig. 8.
Replication of SARS-CoV-2 is restricted by RNase L, independent of PKR or MAVS. Indicated genes were knocked out from A549ACE2 cells using CRISPR-Cas9 engineering. (A) Cell lines were infected with SARS-CoV-2 (MOI = 1). At the times indicated, supernatant was collected and virus quantified by plaque assay on Vero-E6 cells. Values represent mean ± SD. Statistical significance was determined by two-way ANOVA (****P < 0.0001; ns = not significant). Data are one representative experiment from at least three independent experiments. (B) Cells were mock-treated or infected with SARS-CoV-2 (MOI = 1). At 48 hpi, cells were fixed and stained with 1% crystal violet as a marker for live cells. The image is one representative experiment from two independent experiments. (C) The indicated cell lines were mock-infected or infected with SARS-CoV-2 or SINV (MOI = 1). RNA was harvested 24 hpi (SINV) or 24 and 48 hpi (SARS-CoV-2). Integrity of rRNA was assessed by Bioanalyzer. 28S and 18S rRNA bands are indicated. Data are one representative of two independent experiments. (D) Mock-infected or SARS-CoV-2 (MOI = 1) –infected cells were lysed at 48 hpi and proteins harvested. Proteins were analyzed by immunoblotting using the indicated antibodies. Data are from one representative of two independent experiments (SI Appendix, Fig. S5).

Update of

References

    1. Llanes A., et al. ., Betacoronavirus genomes: How genomic information has been used to deal with past outbreaks and the COVID-19 pandemic. Int. J. Mol. Sci. 21, 4546 (2020). - PMC - PubMed
    1. Fehr A. R., Perlman S., Coronaviruses: An overview of their replication and pathogenesis. Methods Mol. Biol. 1282, 1–23 (2015). - PMC - PubMed
    1. Perlman S., Netland J., Coronaviruses post-SARS: Update on replication and pathogenesis. Nat. Rev. Microbiol. 7, 439–450 (2009). - PMC - PubMed
    1. Koetzner C. A., et al. ., Accessory protein 5a is a major antagonist of the antiviral action of interferon against murine coronavirus. J. Virol. 84, 8262–8274 (2010). - PMC - PubMed
    1. Dedeurwaerder A., et al. ., ORF7-encoded accessory protein 7a of feline infectious peritonitis virus as a counteragent against IFN-α-induced antiviral response. J. Gen. Virol. 95, 393–402 (2014). - PubMed

Publication types