. 2021 Apr 15;184(8):2167-2182.e22.
doi: 10.1016/j.cell.2021.03.026. Epub 2021 Mar 16.

BET inhibition blocks inflammation-induced cardiac dysfunction and SARS-CoV-2 infection

Affiliations

BET inhibition blocks inflammation-induced cardiac dysfunction and SARS-CoV-2 infection

Richard J Mills et al. Cell. .

Abstract

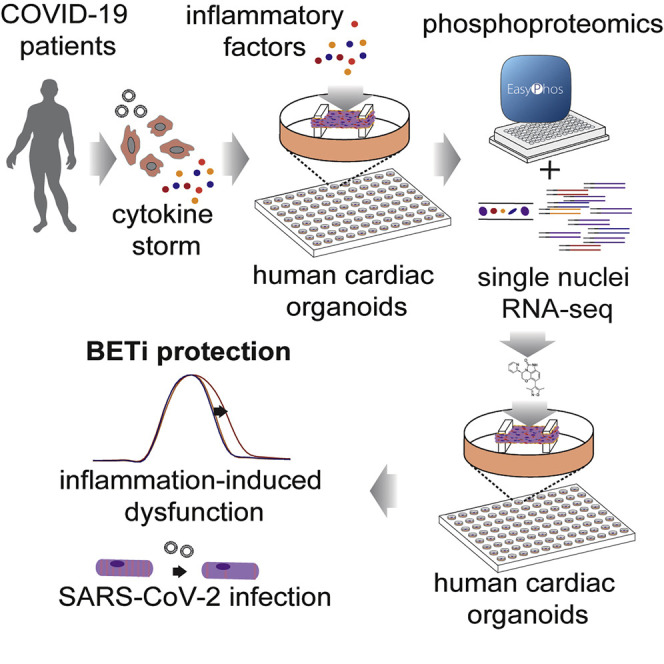
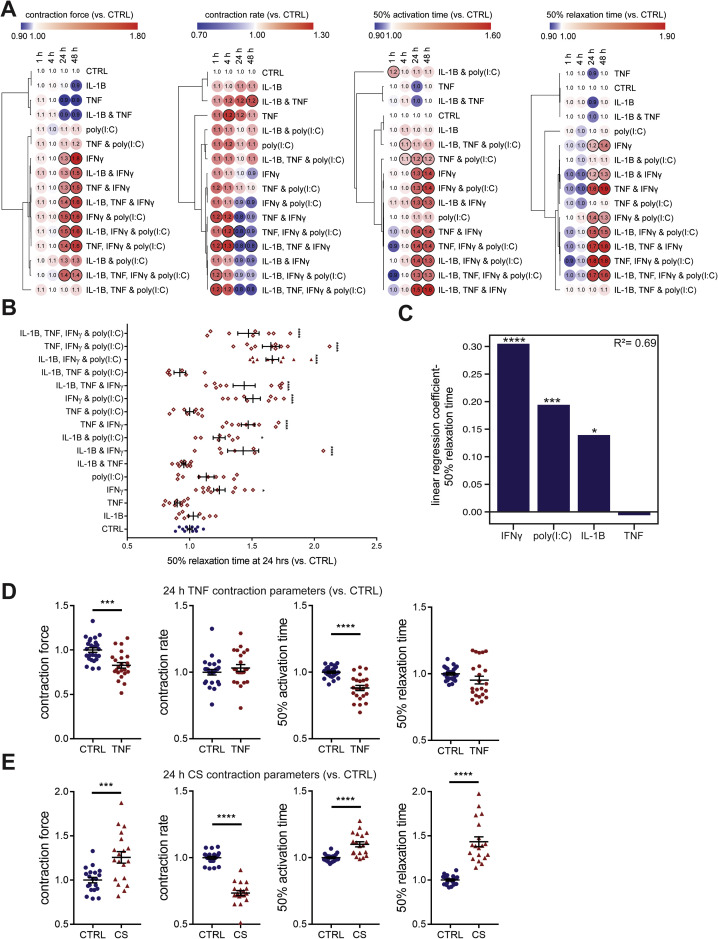
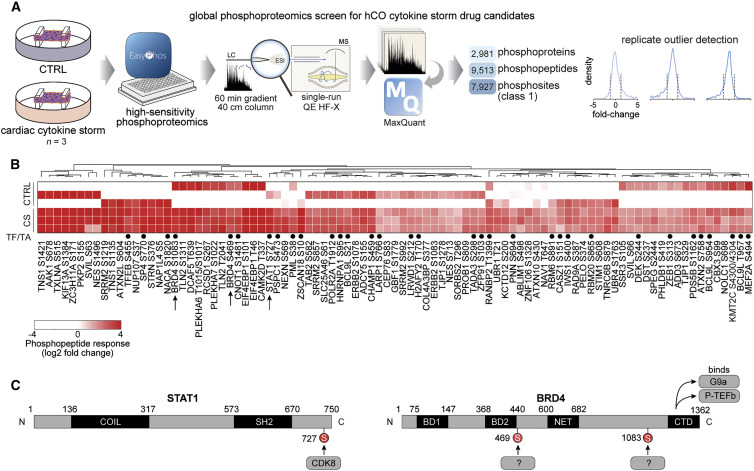
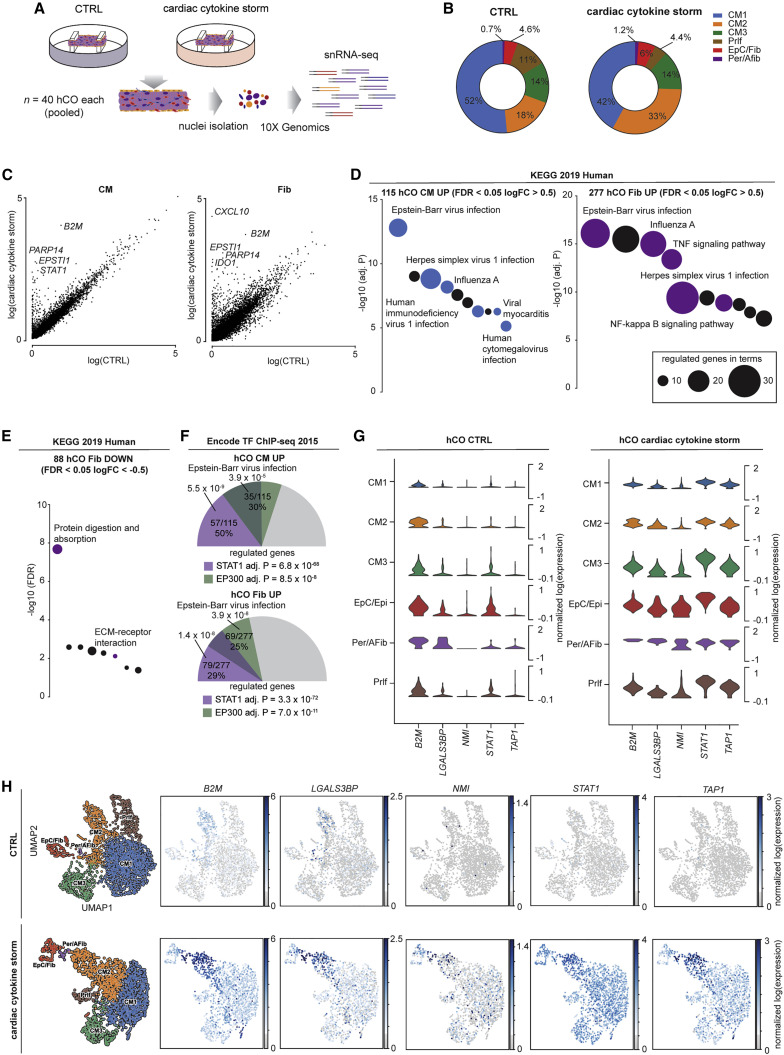
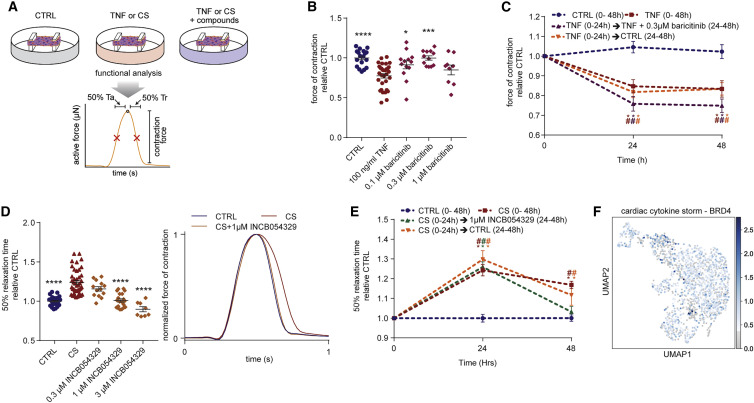
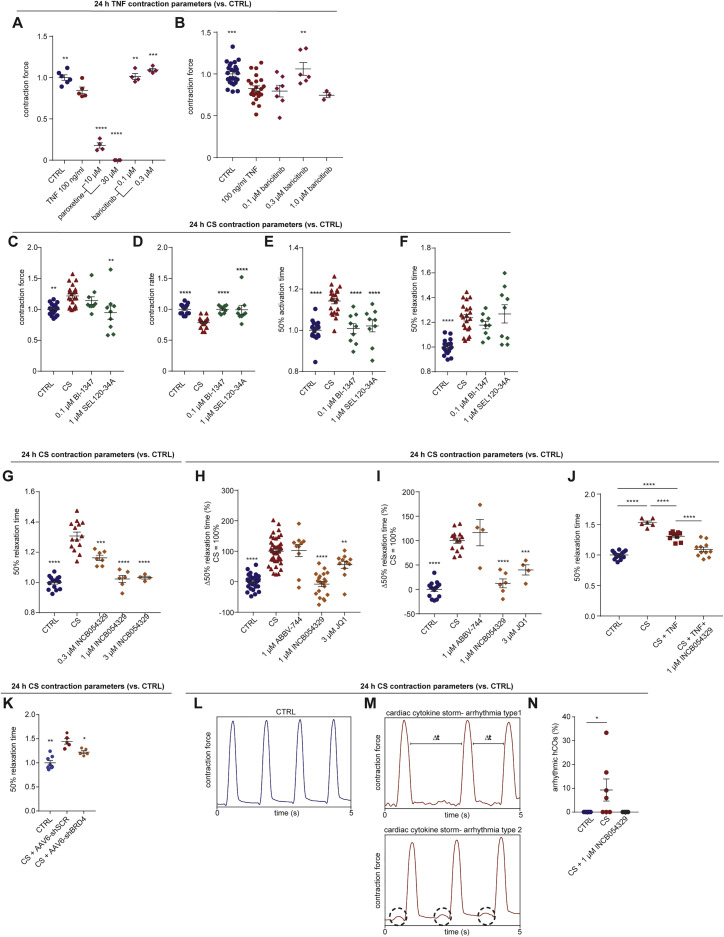
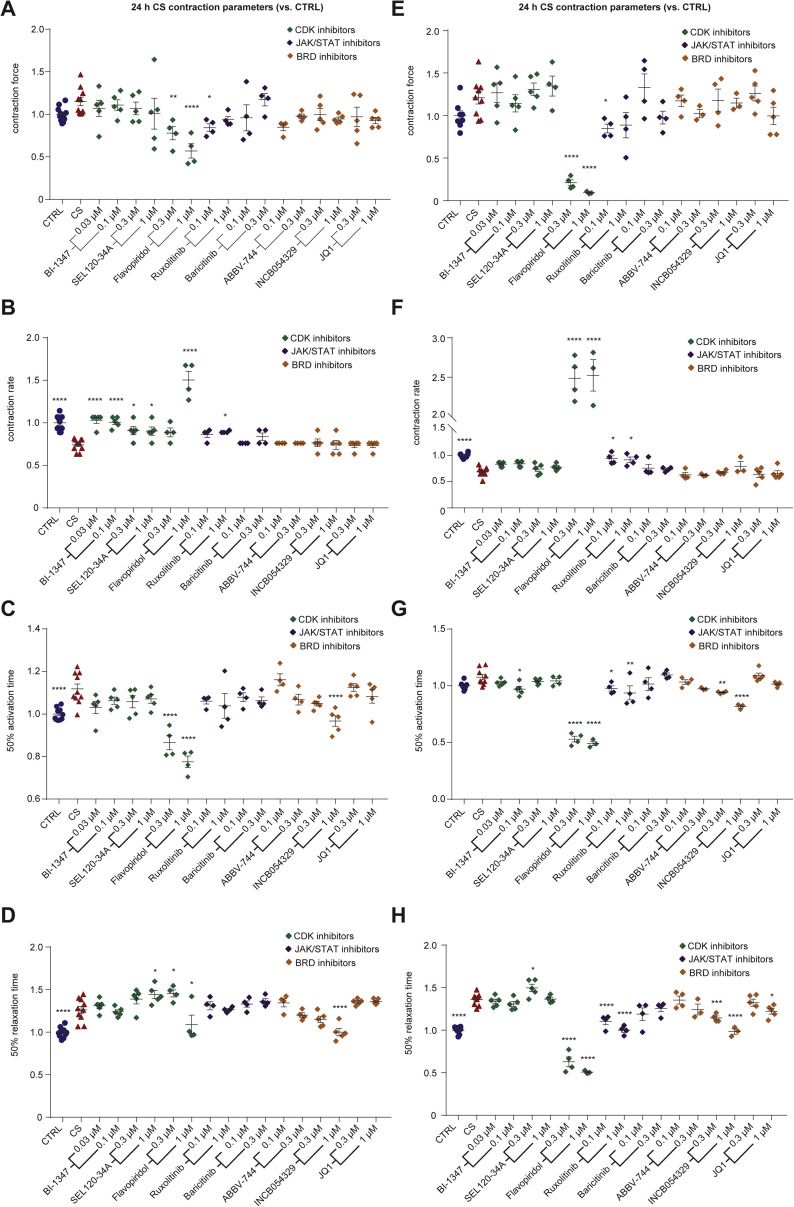
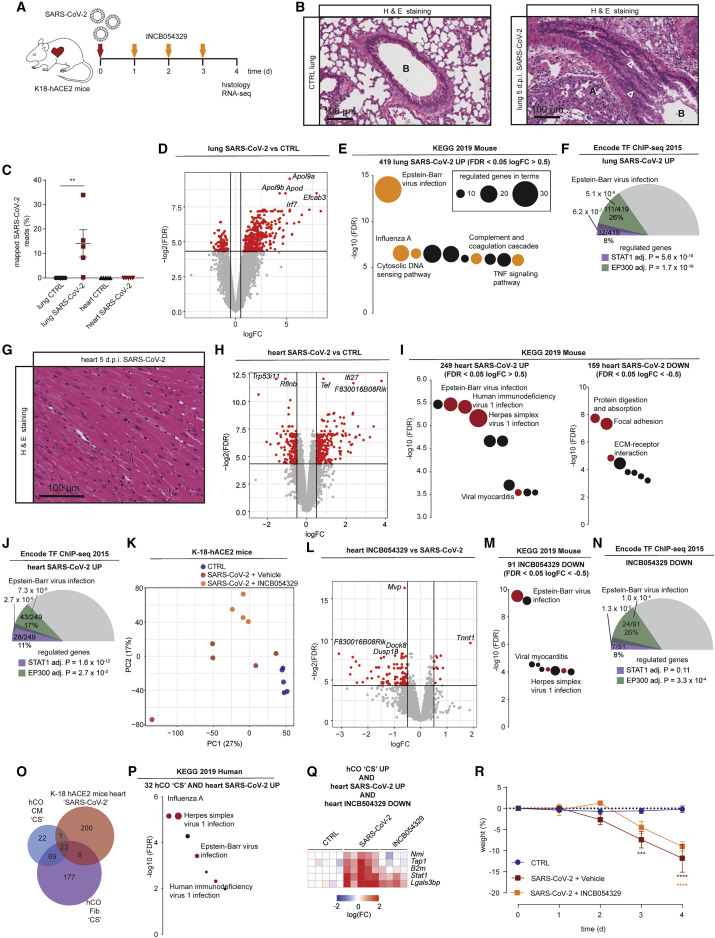
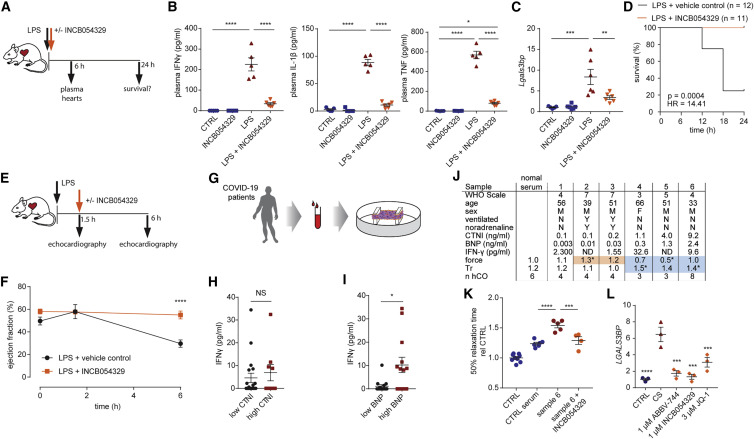
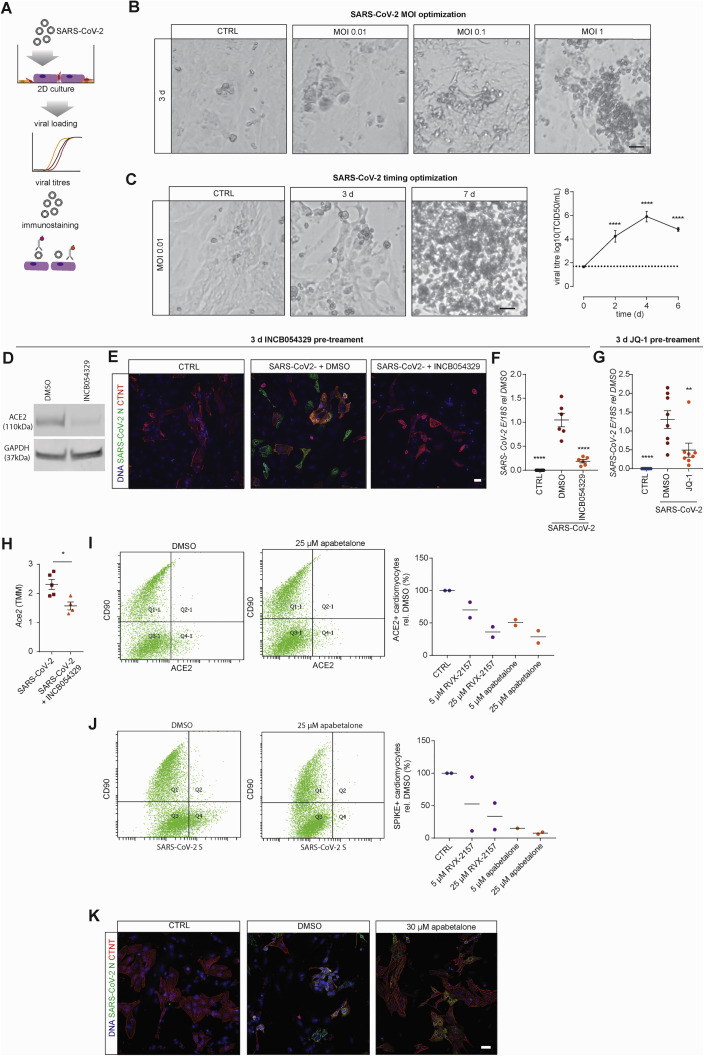
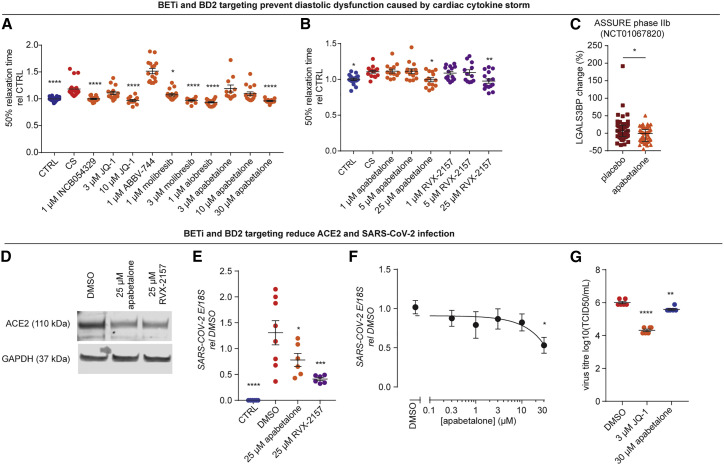
Cardiac injury and dysfunction occur in COVID-19 patients and increase the risk of mortality. Causes are ill defined but could be through direct cardiac infection and/or inflammation-induced dysfunction. To identify mechanisms and cardio-protective drugs, we use a state-of-the-art pipeline combining human cardiac organoids with phosphoproteomics and single nuclei RNA sequencing. We identify an inflammatory "cytokine-storm", a cocktail of interferon gamma, interleukin 1β, and poly(I:C), induced diastolic dysfunction. Bromodomain-containing protein 4 is activated along with a viral response that is consistent in both human cardiac organoids (hCOs) and hearts of SARS-CoV-2-infected K18-hACE2 mice. Bromodomain and extraterminal family inhibitors (BETi) recover dysfunction in hCOs and completely prevent cardiac dysfunction and death in a mouse cytokine-storm model. Additionally, BETi decreases transcription of genes in the viral response, decreases ACE2 expression, and reduces SARS-CoV-2 infection of cardiomyocytes. Together, BETi, including the Food and Drug Administration (FDA) breakthrough designated drug, apabetalone, are promising candidates to prevent COVID-19 mediated cardiac damage.

Keywords: Bromodomain and extraterminal family inhibitors; COVID-19; drug discovery; heart; inflammation; organoids.


Conflict of interest statement

Declaration of interests R.J.M., J.E.H., G.A.Q.-R., D.M.T., and E.R.P. are co-inventors on patents relating to cardiac organoid maturation and cardiac therapeutics. J.E.H. is co-inventor on licensed patents for engineered heart muscle. R.J.M., E.R.P., D.M.T., B.G., and J.E.H. are co-founders, scientific advisors, and stockholders in Dynomics. D.M.T. and B.G. are employees of Dynomics. C.H., D.G., L.F., J.J., M.S., N.C.W.W., and E.K. are employees of Resverlogix. S.J.N. received honoraria and research support from Resverlogix. QIMR Berghofer Medical Research Institute filed a patent on the use of BETi.

Figures

None
Graphical abstract
Figure S1
Figure S1
Expression of immunomodulatory receptors and signaling mediators, related to Figure 1 A) Whole-mount immunofluorescent images of human cardiac organoids stained with CD31 (endothelial cells), NG2 (pericytes), cardiac troponin T (cardiomyocytes) and Hoescht33342. Scale = 50 μm. B) Comparison of immunomodulatory receptors and signaling mediators in human cardiac organoids relative to human adult heart using existing bulk RNA-sequencing data (n = 4 experiments for hCO) (Mills et al., 2017). All were identified in human cardiac organoids except CSF1R which is leukocyte specific. C) Cell type specificity of immunomodulatory receptors and signaling mediators in adult mouse hearts using existing bulk RNA-sequencing data (n = 4 experiments) (Quaife-Ryan et al., 2017). D) Normalized expression of genes in human cardiac organoids that mark the human heart sub-populations defined in Tucker et al., 2020. E) UMAP clustering of single nuclei RNA-sequencing of human cardiac organoids using the enhanced protocol (H.K.V. et al., unpublished data). Location of key markers for different cell populations are also highlighted. F) Principal component analysis of our single nuclei RNA-sequencing in comparison to purified bulk RNA-sequencing of purified human cardiomyocyte nuclei (Gilsbach et al., 2018). G) Expression of immunomodulatory receptors and signaling mediators in different cell populations in the human cardiac organoids. Data presented as mean ± SEM hCO – human cardiac organoids. Human pluripotent stem cell-derived cardiac cells- AA line. Endothelial cells- RM3.5 line.
Figure 1
Figure 1
Identification of pro-inflammatory factors driving cardiac dysfunction (A) Schematic of experiments. Mean of n = 1,100 human cardiac organoids from 9 experiments. (B) Impact of inflammatory modulators on force (systolic function). n = 3–5 human cardiac organoids from 1 experiment. (C) Impact of inflammatory modulators on time to 50% relaxation (diastolic function). n = 3–5 human cardiac organoids from 1 experiment. (D) TNF causes systolic dysfunction. n = 37 and 63 human cardiac organoids for CTRL and TNF conditions, respectively, from 6 experiments. (E) Cardiac cytokine storm (CS) causes diastolic dysfunction n = 49 and 73 human cardiac organoids for CTRL and CS conditions, respectively, from 6 experiments. (F) Representative force curve of human cardiac organoids under CTRL and CS conditions (1 Hz) 48 h after treatment. Time to 50% relaxation under paced conditions (1 Hz) 48 h after treatment. n = 15 and 17 human cardiac organoids from 3 experiments. Data presented as mean ± SEM. Cardiac CS: IL-1β, IFN-γ, and poly(I:C). Ta, time from 50% activation to peak; Tr, time from peak to 50% relaxation. Human pluripotent stem cell (hPSC)-derived cardiac cells AA line (B and C) and HES3 line (D–F). Endothelial cells RM3.5 line (B and C) and RM3.5 or CC lines (D–F). Bold outline indicates p < 0.05 using a one-way ANOVA with Dunnett’s multiple comparisons test comparing each condition to CTRL at the respective time points (B and C). ∗∗p < 0.01, ∗∗∗p < 0.001, ∗∗∗∗p < 0.0001, using Student’s t test (D, E, and F). See additional functional data in Figures S1, S2, and S3. Inflammatory screen in (B)–(E) repeated in an additional cell line in Figure S3. See also Videos S1, S2, S3, and S4.
Figure S2
Figure S2
Screening for the impact of pro-inflammatory factors on human cardiac organoid function, related to Figure 1 A) Contraction force B) Contraction rate C) Time from 50% activation to peak D) Time from peak to 50% relaxation (A-D) Human cardiac organoid function normalized to baseline contraction parameters at 0 hr. # Due to a microscope camera shutter issue at the 0 h time point, IL-1β & IL-17A is normalized to the 1 h time point. Bold outline indicates p < 0.05 using a one-way ANOVA with Dunnett’s multiple comparisons test comparing each condition to CTRL at comparable time point. n = 2-5 human cardiac organoids for treatments, n = 7-9 human cardiac organoids for CTRL from 1 experiment. Data are presented as mean ± SEM. Bold outline indicates p < 0.05 using a one-way ANOVA with Dunnett's multiple comparisons test comparing each condition to CTRL at the respective time points. Human pluripotent stem cell-derived cardiac cells- AA line. Endothelial cells- RM3.5 line. E) Coefficients of linear regression performed using binary predictors (cytokine presence/absence) with time from peak to 50% relaxation as the outcome variable at 24 h. Coefficients represent the mean change in the response given one unit change in the predictor. Sign of the coefficient represents the direction of the change between predictor and response. Overall, presence of IFN-γ, IL-1β, poly(I:C) all lead to increased relaxation times while presence of TNF leads to a reduced relaxation time. p < 0.05, ∗∗p < 0.01, ∗∗∗∗p < 0.0001 using regression modeling with a two-tailed t tests. F) Dose-response curves for TNF, force of contraction G) Dose-response curves for IFN-γ, time to 50% relaxation H) Dose-response curves for IL-1β, time to 50% relaxation I) Dose-response curves for poly(I:C), time to 50% relaxation (F-I) n = 4-5 human cardiac organoids per condition per concentration from 1 experiment. Data are presented as mean ± SEM. Human pluripotent stem cell-derived cardiac cells- HES3 line. Endothelial cells- RM3.5 line. Dose-response curve was generated using nonlinear regression (variable slope model, sigmoidal- 4 parameter logistic) to determine cytokine EC50.
Figure S3
Figure S3
Validation of pro-inflammatory factor screen in an additional cell line and regression analysis, related to Figure 1 A) Validation of functional inflammatory modulator screening parameters in an additional cell line. n = 2-6 human cardiac organoids for treatments, n = 7 human cardiac organoids for CTRL from 1 experiment. B) Overall impact of inflammatory modulators on time to 50% relaxation (diastolic function) at 24 h for both lines tested. n = 6-12 human cardiac organoids from 2 experiments. C) Coefficients of linear regression performed (order = 2) using binary predictors (cytokine presence/absence) with relaxation time as the outcome variable. Coefficients represent the mean change in the response given one unit change in the predictor. Sign of the coefficient represents the direction of the change between predictor and response. The presence of IFN-γ, poly(I:C) and IL-1β lead to increased time to 50% relaxation. D) Validation of TNF systolic dysfunction in an additional cell line. n = 23-25 from 3 experiments. E) Validation of cardiac cytokine storm (CS) induced diastolic dysfunction in an additional cell line. n = 19-20 human cardiac organoids from 3 experiments Data presented as mean ± SEM. Cardiac cytokine storm (CS): IL-1β, IFN-γ and poly(I:C). Human pluripotent stem cell-derived cardiac cells - HES3 (A), HES3 and AA (B) or AA (D,E) lines. Endothelial cells – CC (A), RM3.5 (B), or RM3.5 and CC (D,E) lines. Bold outline indicates p < 0.05 using one-way ANOVA with Dunnett’s multiple comparisons test comparing each condition to CTRL at its’ time point (A). p < 0.05, ∗∗∗p < 0.001, ∗∗∗∗p < 0.0001 using using one-way ANOVA with Dunnett’s multiple comparisons test comparing each condition to CTRL (B), regression modeling (C) or Students t test (D,E).
Figure S4
Figure S4
Populations in human cardiac organoids treated with cardiac cytokine storm, related to Figure 3 A) Normalized expression of genes in human cardiac organoids that mark the human heart sub-populations defined in Tucker et al., 2020. B) UMAP clustering of single nuclei RNA-sequencing data for cardiac cytokine storm treated human cardiac organoids. Location of key markers for different cell populations are highlighted.
Figure 2
Figure 2
Phosphoproteomics reveals signaling driving cardiac dysfunction (A) Schematic of the experiment. (B) Enriched phosphopeptides in human cardiac organoids following CS treatment after 1 h. TF/TA circles depict transcription factors and transcriptional activators. (C) Phosphorylation sites induced by CS on STAT1 and BRD4 proteins. CS, cardiac cytokine storm; AA line, human pluripotent stem cell-derived cardiac cells; RM3.5 line, endothelial cells.
Figure 3
Figure 3
Single nuclei RNA-sequencing reveals cardiac cytokine storm activates viral responses in human cardiac organoids (A) Schematic of experiment. (B) Cell compositions identified in single nuclei RNA-sequencing. (C) Differential normalized log2 expression in cardiomyocytes and fibroblasts following cardiac cytokine storm (CS) treatment (all populations pooled for each cell type). (D) Activation of viral responses in cardiomyocytes and fibroblasts revealed using KEGG pathway analysis of upregulated genes. Size represents number of genes regulated and the pathways of the colored circles are highlighted by the text. (E) Repression of extracellular matrix processes in fibroblasts revealed using KEGG pathway analysis of downregulated genes. Size represents number of genes regulated and the pathways of the colored circles are highlighted by the text. (F) STAT1 and EP300 are predicted as key transcriptional mediators. Values presented are adjusted p values, number of genes regulated by the transcription factor/number of genes regulated, and % of genes regulated over the total. The size of the colored slices represent the fraction of genes regulated (180° = 100%), and overlaps for each transcription factor are also depicted. (G) Key upregulated genes (see Figure 5Q) in CS-treated human cardiac organoids. (H) UMAP of CTRL and CS-treated human cardiac organoid subpopulations and expression of key regulated genes. hCO, human cardiac organoid; CM, cardiomyocyte; Prlf, proliferating; EpC, epicardial cells; Fib, fibroblasts; Per, pericytes; Afib, activated fibroblasts; HES3 line, human pluripotent stem cell-derived cardiac cells; RM3.5 line, endothelial cells. See also Figure S4.
Figure 4
Figure 4
Discovery of drugs that improve cardiac function (A) Schematic of experiment. (B) Protection against systolic dysfunction (force of contraction) by baricitinib. n = 9–32 human cardiac organoids from 2–3 experiments. (C) Assessment of human cardiac organoid recovery from TNF and baricitinib treatment. n = 6–12 human cardiac organoids from 1–2 experiments. (D) Protection against diastolic dysfunction (time to 50% relaxation time) by INCB054329. n = 8–43 human cardiac organoids from 2–4 experiments. (E) Assessment of human cardiac organoid recovery from CS and INCB054329 treatment. n = 6–11 human cardiac organoids from 1–2 experiments. (F) BRD4 is expressed in all cell populations in human cardiac organoids. CS, cardiac cytokine storm. Data presented as mean ± SEM. HES3, human pluripotent stem cell-derived cardiac cells; RM3.5, endothelial cells. p < 0.05, ∗∗∗p < 0.001, ∗∗∗∗p < 0.0001 using one-way ANOVA with Dunnett’s multiple comparisons test compared to TNF (B) or compared to CS (D). #p < 0.05 compared to CTRL at the same time-point, and p < 0.05 compared to specific condition at 0 h with color indicating comparison, using two-way ANOVA with Dunnett’s multiple comparisons test compared to CTRL (C and E). Drug screening was confirmed across in an additional cell line, and additional data are provided in Figures 6 and S5. See also Figure S6 and Video S5.
Figure S5
Figure S5
Drugs and targets protecting against inflammation-driven dysfunction in human cardiac organoids, related to Figure 4 A) Human cardiac organoids were concurrently treated with 100 ng/ml TNF and inhibitors and then functionally assessed at 24 h. n = 4-6 human cardiac organoids from 1 experiment. B) Validation in an additional cell line. Human cardiac organoids were concurrently treated with 100 ng/ml TNF and inhibitors and then functionally assessed at 24 h. n = 3-23 human cardiac organoids from 1-2 experiments. (C-F) Human cardiac organoids were concurrently treated with the cardiac cytokine storm and CDK8-STAT1 S727 inhibitors, and then functionally assessed at 24 h. n = 9-21 human cardiac organoids from 2 experiments. C) Contraction force. D) Contraction rate. E) Time from 50% activation to peak. F) Time to 50% relaxation. G) Validation of INCB054329 protection in an additional cell line. Time to 50% relaxation. Human cardiac organoids were concurrently treated with the cardiac cytokine storm and INCB054329, and then functionally assessed at 24 h. n = 4-12 human cardiac organoids from 1-2 experiments. H) Multiple bromodomain extraterminal protein inhibition prevents cardiac cytokine storm induced diastolic dysfunction, presented as change relative to increased relaxation time. n = 8-43 human cardiac organoids from 2-4 experiment. I) Validation of results in an additional cell line. Multiple bromodomain extraterminal protein inhibition prevents cardiac cytokine storm induced diastolic dysfunction, presented as change relative to increased relaxation time. n = 14-15 for CTRL and cardiac cytokine storm conditions and 4-6 human cardiac organoids from 1-2 experiments. J) Assessment of INCB054329 efficacy in conditions with cardiac cytokine storm with the addition of TNF. n = 6-16 human cardiac organoids from 1-2 experiments. K) BRD4 knockdown prevents cardiac cytokine storm induced diastolic dysfunction, presented as normalized relaxation time. n = 5-8 human cardiac organoids from 1 experiment. L) Representative force trace of a CTRL human cardiac organoid. M) Representative force trace of different types of arrhythmias in human cardiac organoids treated with cardiac cytokine storm. N) Arrhythmic events in human cardiac organoids per experiment. n = 4-7 experiments. CS – cardiac cytokine storm. Data presented as mean ± SEM. Human pluripotent stem cell-derived cardiac cells- HES3 (A,C-F,H,J,K [with no endothelial cells], L-N) or AA (B,G,I) lines. Endothelial cells- RM3.5 (A,C-F,H,J,L-N) or CC(B,G,I) lines. p < 0.05, ∗∗p < 0.01, ∗∗∗p < 0.001, ∗∗∗∗p < 0.0001, using a one-way ANOVA with Dunnett’s multiple comparisons test compared to TNF (A,B) CS (C-I), CS + AAV6-shSCR (scramble control) (K) or with Tukey’s multiple comparison test (J) or with Kruskal-Wallis comparisons test to CTRL (N).
Figure S6
Figure S6
Screening for compounds that prevent cardiac cytokine storm induced diastolic dysfunction, related to Figure 4 A) Contraction force in human cardiac organoids. B) Contraction rate in human cardiac organoids. C) Time to 50% activation in human cardiac organoids. D) Time to 50% relaxation in human cardiac organoids. E) Contraction force in human cardiac organoids from an additional line. F) Contraction rate in human cardiac organoids from an additional line. G) Time to 50% activation in human cardiac organoids from an additional line. H) Time to 50% relaxation in human cardiac organoids from an additional line. Human cardiac organoids were concurrently treated with the cardiac cytokine storm (CS) and compounds, and then functionally assessed at 24 h. (A-D) n = 4-11 and (E-F) n = 3-9 hCOs per condition from 1 experiment. Data presented as mean ± SEM. Human pluripotent stem cell –derived cardiac cells - HES3 (A-D) or AA (E-H) lines. Endothelial cells – RM3.5 (A–D) or CC (E–H) lines. p < 0.05, ∗∗p < 0.01, ∗∗∗p < 0.001, ∗∗∗∗p < 0.0001, using one-way ANOVA with Dunnett’s multiple comparisons test compared to cardiac cytokine storm.
Figure 5
Figure 5
SARS-CoV-2 activates viral responses in the heart repressed by INCB054329 (A) Schematic of the experiment. (B) Lungs of SARS-CoV-2-infected K18-hACE2 mice 5 days post infection. Infection causes sloughing of bronchial epithelium, and white arrowheads show (A) collapse of alveolar spaces and (B) bronchiolar lumen. (C) Severe lung infection with no/negligible heart infection at 4 days post infection. n = 5 mice per group. (D) Lung RNA-sequencing reveals a robust upregulation (logFC >0.5) of 419 genes and downregulation (logFC <−0.5) of 98 genes, both FDR <0.05. n = 5 mice per group. (E) Activation of viral responses in lungs revealed using KEGG pathway analysis of upregulated genes. Size represents number of genes regulated and the pathways of the colored circles are highlighted by the text. (F) Stat1 and Ep300 are predicted as key transcriptional mediators of infection in the lungs. (G) Hearts of SARS-CoV-2-infected K18-hACE2 mice 5 days post infection. Relatively normal, with no significant necrosis, fibrosis (Masson’s Tri-chrome not shown), or immune infiltrates. (H) Heart RNA-sequencing reveals a robust upregulation (logFC >0.5) of 249 and downregulation (logFC <−0.5) of 159 genes, both FDR <0.05. n = 5 mice per group. (I) Activation of viral responses in hearts revealed and repression of ECM using KEGG pathway analysis of upregulated genes and downregulated genes. Size represents number of genes regulated and the pathways of the colored circles are highlighted by the text. (J) Stat1 and Ep300 are predicted as key transcriptional mediators in the heart. (K) PCA of heart RNA-sequencing samples. n = 4–5. (L) Heart RNA-sequencing reveals a robust upregulation (logFC >0.5) of 11 genes and downregulation (logFC <−0.5) of 91 genes, both FDR <0.05 by INCB054329. n = 4–5 mice per group. (M) Repression of viral responses in hearts revealed using KEGG pathway analysis of downregulated genes. Size represents number of genes regulated and the pathways of the colored circles are highlighted by the text. (N) Ep300 is predicted as the key transcriptional mediator of INCB054329 effects in the heart. (O) Cross-analysis of the transcriptional responses in human cardiac organoids with hearts of SARS-CoV-2-infected K18-hACE2 mice. (P) Co-regulated genes in (O) reveal a consistent activation of viral responses in both models using KEGG pathway analysis of upregulated genes. Size represents number of genes regulated, and the pathways of the colored circles are highlighted by the text. (Q) Genes induced by both CS in human cardiac organoids and SARS-CoV-2-infected K18-hACE2 mouse hearts that are also repressed by INCB054329. (R) Severe weight loss by 4–5 days post infection in SARS-CoV-2-infected K-18-hACE2 mice is due to severe lung infection and brain infection, and euthanasia is required. d.p.i., days post infection; CS, cardiac cytokine storm. Data presented as mean ± SEM. ∗∗p < 0.01 using Mann-Whitney, ∗∗∗p < 0.001 and ∗∗∗∗p < 0.0001 using two-way ANOVA with Sidak’s post hoc test compared to CTRL. (D, H, and L) Red dots are regulated as per the described cut-offs and gray dots are not. (F, J, and N) Values presented are adjusted p values, number of genes regulated by the transcription factor/number of genes regulated, and % of genes regulated over the total. The size of the colored slices represent the fraction of genes regulated (180° = 100%), and overlaps for each transcription factor are also depicted. Additional data bioinformatic analysis is provided in Tables S1A–S1C.
Figure 6
Figure 6
INCB054329 prevents cardiac dysfunction in a mouse lipopolysaccharide-induced cytokine storm model and in response to COVID-19 patient serum (A) Schematic for (B)–(D). (B) INCB054329 blocks cytokine induction 6 h after lipopolysaccharide injection. n = 5–6 mice. (C) INCB054329 blocks induction of Lgals3bp 6 h after lipopolysaccharide injection. n = 5–6 mice. (D) Kaplan-Meier curve of survival after lipopolysaccharide injection. n = 12 control and 11 INCB054329 treatment (67 mg/kg). (E) Schematic for (F). (F) INCB054329 prevents the reduction in ejection fraction 6 h after lipopolysaccharide injection. n = 3–4 mice at 0 and 1.5 h, and n = 8 at 6 h. (G) Schematic for (H)–(K). (H) IFN-γ was not higher in patients with elevated cardiac troponin I (CTNI >0.5 ng/mL). n = 27. (I) IFN-γ was higher in patients with elevated brain natriuretic peptide (BNP >0.3 ng/mL). n = 27. (J) Serum from COVID-19 patients with elevated brain natriuretic peptide induces diastolic dysfunction. Orange highlights human cardiac organoids with elevated force of contraction. Blue highlights dysfunctional human cardiac organoids. (K) Diastolic dysfunction induced by COVID-19 patient 6 serum is prevented by 1 μM INCB054329. n = 4–9 human cardiac organoids from 1 experiment. (L) LGALS3BP is induced by CS and repressed by bromodomain and extraterminal protein inhibition in human cardiac organoids. n = 3 each (2 human cardiac organoids pooled per n). LPS, lipopolysaccharide; CS, cardiac cytokine storm. Data presented as mean ± SEM. HES3 line, human pluripotent stem cell-derived cardiac cells; RM3.5 line, endothelial cells. p < 0.05, ∗∗p < 0.01, ∗∗∗p < 0.001, and ∗∗∗∗p < 0.0001, using one-way ANOVA with Tukey’s multiple comparisons test (B and C), with Dunnett’s multiple comparisons test compared to CTRL serum (J and K) or CS (L), or using two-way ANOVA with Sidak’s multiple comparisons test (F) or Mann-Whitney (I). p value calculated using Gehan-Breslow-Wilcoxon test (D). Additional patient data are provided in Tables S2A and S2B.
Figure S7
Figure S7
Pre-treatment with INCB054329 prevents SARS-CoV-2 infection of cardiac cells, related to Figure 7 A) Schematic of the experiments. B) Optimization of loading with increasing cell death of 2D cardiac cells with increasing SARS-CoV-2 infection. C) Infection at low multiplicity of infection (0.01) results in viral replication and eventually death following SARS-CoV-2 infection of 2D cardiac cells. n = 6 from 3 experiments. D) ACE2 expression in 2D cultured cardiac cells pre-treated with 1 μM INCB054329 for 3 days. E) Immunostaining of cardiomyocytes and SARS-CoV-2 reveals that 1 μM INCB054329 reduces viral loading. F) Pre-treatment with 1 μM INCB054329 for 3 days reduces SARS-CoV-2 infection. E-gene expression in 2D cultured cardiac cells 3 days after infection. n = 6 from 2 experiments. G) Pre-treatment with 3 μM JQ-1 for 3 days reduces SARS-CoV-2 infection. E-gene expression in 2D cultured cardiac cells 3 days after infection. n = 8 from 2 experiments. H) INCB054329 decreases endogenous mAce2 expression in hearts in vivo. n = 4-5 mice. I) Flow cytometry analysis of ACE2 on cardiomyocytes (CD90 negative) and CD90 positive stromal cells. Analysis was performed in 2 different cells lines in separate experiments. J) Flow cytometry analysis of spike protein binding on cardiomyocytes (CD90 negative) and CD90 positive stromal cells. Analysis was performed in 2 different cells lines in separate experiments. K) Immunostaining of cardiomyocytes and SARS-CoV-2 reveals that 30 μM apabetalone preserves cardiomyocyte structures and reduces viral loading. All scale bars = 20 μm. TCID50 - Fifty-percent tissue culture infective dose. Data presented as mean ± SEM. Human pluripotent stem cell-derived cardiac cells – HES3 (C,D,K), AA (E,F) or HES3 and AA (G,I,J) lines. p < 0.05, ∗∗∗∗p < 0.0001, using one-way ANOVA with Dunnett’s multiple comparisons test (C - compared day 0 and F,G – compared to DMSO) and Mann-Whitney (H).
Figure 7
Figure 7
Bromodomain and extraterminal protein inhibitors targeting bromodomain 2 are effective therapeutic candidates (A) All bromodomain and extraterminal protein inhibitors (except ABBV-744) used in clinical trials prevent CS-induced diastolic dysfunction. n = 12–19 human cardiac organoids from 3 experiments. (B) Bromodomain and extraterminal protein inhibitors specific (RVX-2157) or selective (apabetalone) for bromodomain 2 prevent CS-induced diastolic dysfunction. n = 12–18 human cardiac organoids from 3 experiments. (C) Apabetalone decreases serum LGALS3BP in the phase IIb ASSURE clinical trial. Data are changes from baseline. n = 47 both groups. (D) Bromodomain and extraterminal protein inhibitors specific (RVX-2157) or selective (apabetalone) for bromodomain 2 decrease ACE2 expression after 3 days. (E) Pre-treatment for 3 days with bromodomain and extraterminal protein inhibitors specific (RVX-2157) or selective (apabetalone) for bromodomain 2 reduce SARS-CoV-2 infection. E-gene expression in 2D cultures 3 days after infection. n = 6–8 from 2 experiments. (F) Apabetalone 3-day pre-treatment to reduce SARS-CoV-2 infection. E-gene expression in 2D cultures 3 days after infection. n = 6 from 1 experiment. (G) Apabetalone or JQ-1 3-day pre-treatment reduces SARS-CoV-2 titer in hPSC-CM 3 days after infection. n = 6 from 1 experiment. CS, cardiac cytokine storm; TCID50, 50% tissue culture infective dose. Human pluripotent stem cell-derived cardiac cells (HES3 line) (no endothelial cells) (A–C, F, and G) or HES3 and AA lines (E). Data presented as mean ± SEM for all plots except for (C), which is median ± interquartile range. p < 0.05, ∗∗p < 0.01, ∗∗∗p < 0.001, ∗∗∗∗p < 0.0001, using one-way ANOVA with Dunnett’s multiple comparisons test (A and B, compared to CS; E–G, compared to DMSO) or Mann-Whitney (C). See also Figure S7.

Comment in

References

    1. Anand P., Brown J.D., Lin C.Y., Qi J., Zhang R., Artero P.C., Alaiti M.A., Bullard J., Alazem K., Margulies K.B., et al. BET bromodomains mediate transcriptional pause release in heart failure. Cell. 2013;154:569–582. - PMC - PubMed
    1. Anderson D.J., Kaplan D.I., Bell K.M., Koutsis K., Haynes J.M., Mills R.J., Phelan D.G., Qian E.L., Leitoguinho A.R., Arasaratnam D., et al. NKX2-5 regulates human cardiomyogenesis via a HEY2 dependent transcriptional network. Nat. Commun. 2018;9:1373. - PMC - PubMed
    1. Antolic A., Wakimoto H., Jiao Z., Gorham J.M., DePalma S.R., Lemieux M.E., Conner D.A., Lee D.Y., Qi J., Seidman J.G., et al. BET bromodomain proteins regulate transcriptional reprogramming in genetic dilated cardiomyopathy. JCI Insight. 2020;5:138687. - PMC - PubMed
    1. Arunachalam P.S., Wimmers F., Mok C.K.P., Perera R.A.P.M., Scott M., Hagan T., Sigal N., Feng Y., Bristow L., Tak-Yin Tsang O., et al. Systems biological assessment of immunity to mild versus severe COVID-19 infection in humans. Science. 2020;369:1210–1220. - PMC - PubMed
    1. Auguste G., Rouhi L., Matkovich S.J., Coarfa C., Robertson M.J., Czernuszewicz G., Gurha P., Marian A.J. BET bromodomain inhibition attenuates cardiac phenotype in myocyte-specific lamin A/C-deficient mice. J. Clin. Invest. 2020;130:4740–4758. - PMC - PubMed

Publication types

MeSH terms