. 2021 Aug:74:105156.
doi: 10.1016/j.tiv.2021.105156. Epub 2021 Mar 31.

Physiologically relevant oxygen tensions differentially regulate hepatotoxic responses in HepG2 cells

Affiliations

Physiologically relevant oxygen tensions differentially regulate hepatotoxic responses in HepG2 cells

Thomas J DiProspero et al. Toxicol In Vitro. 2021 Aug.

Abstract

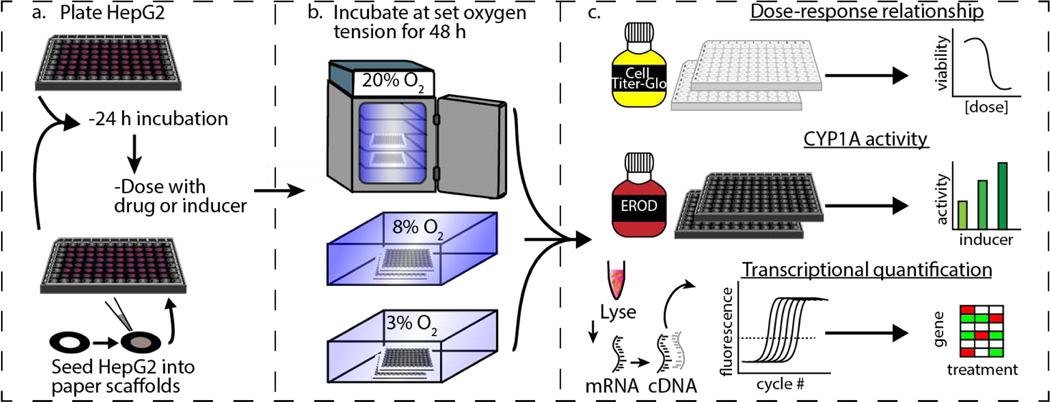
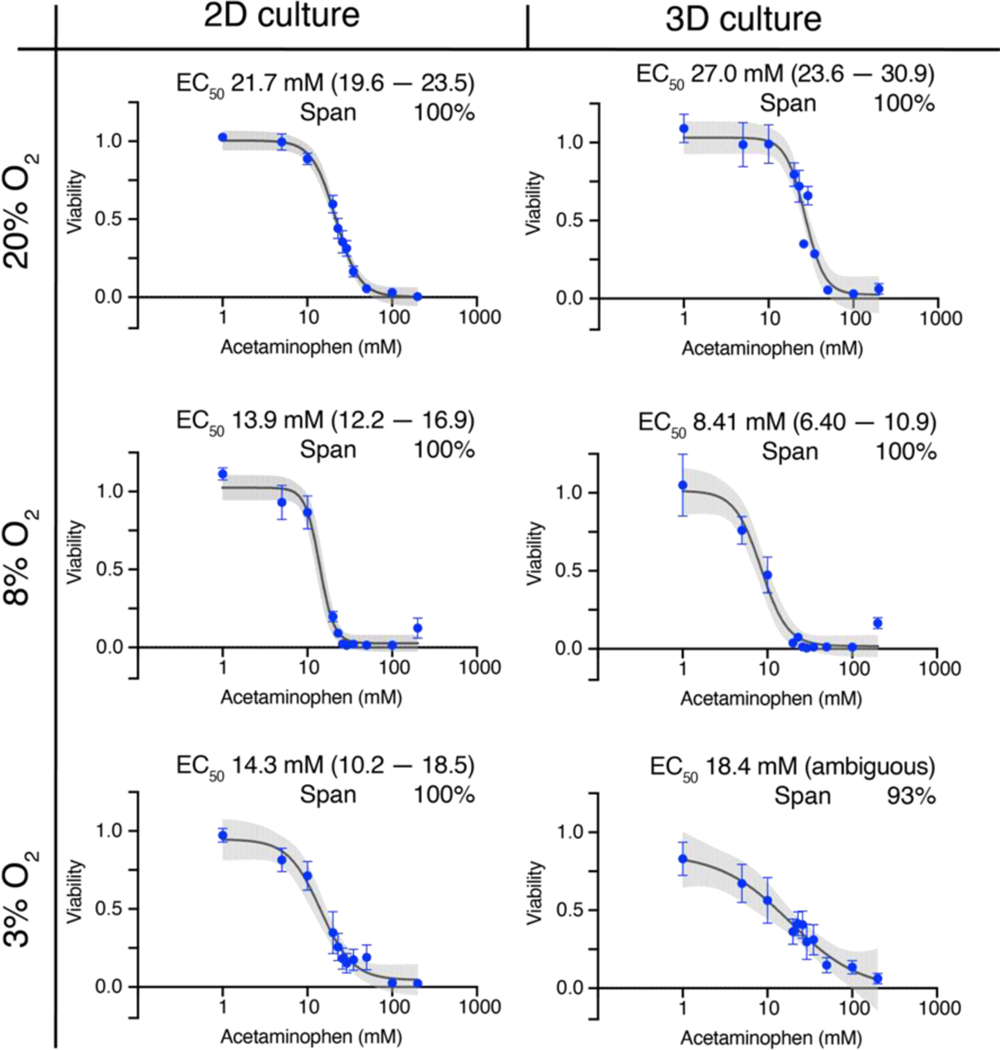
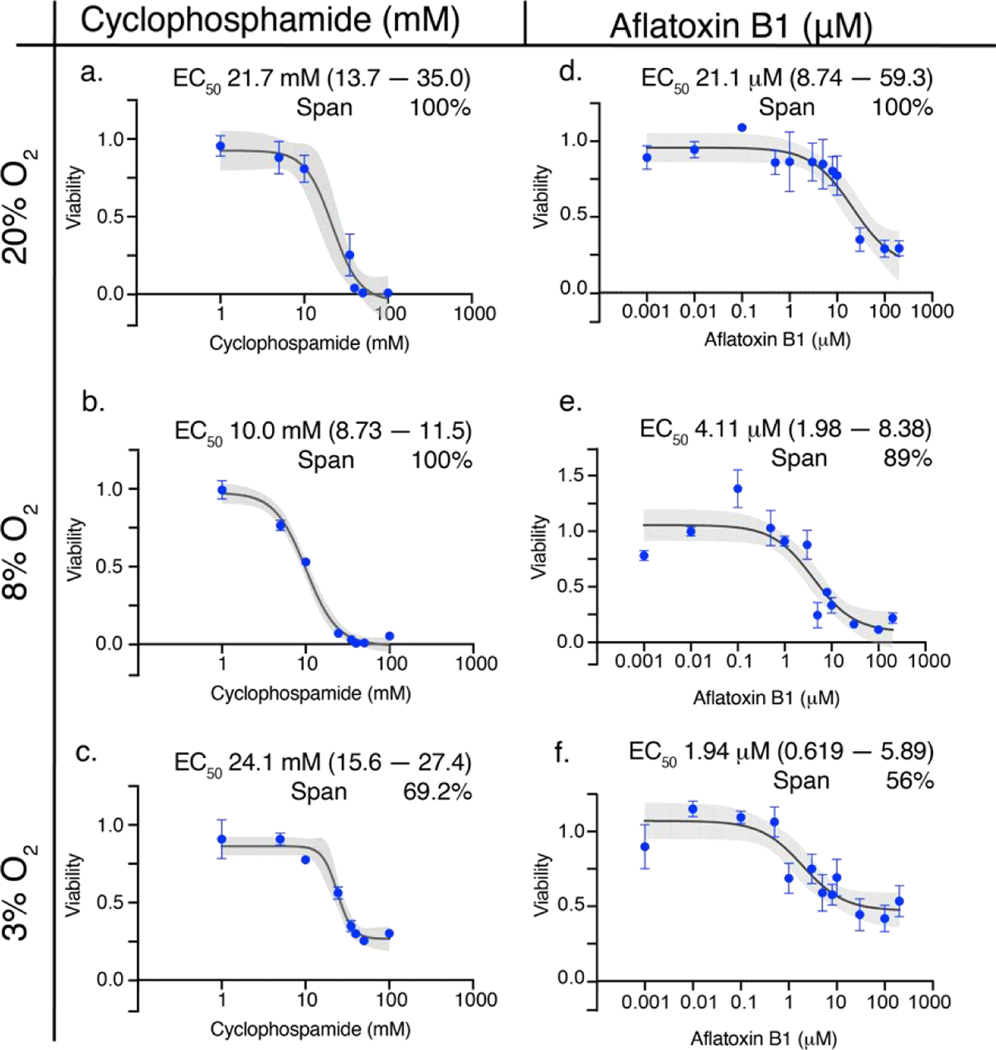
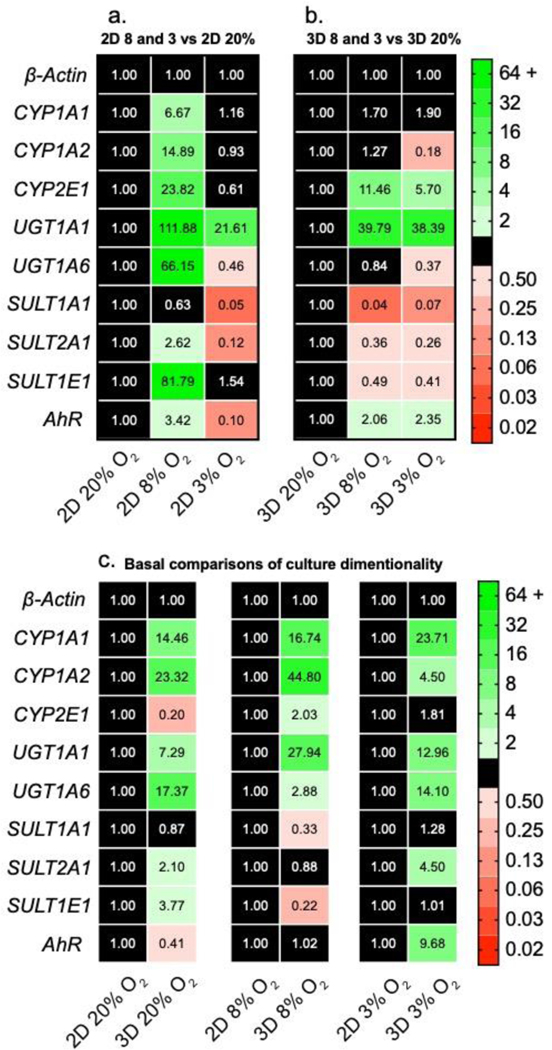
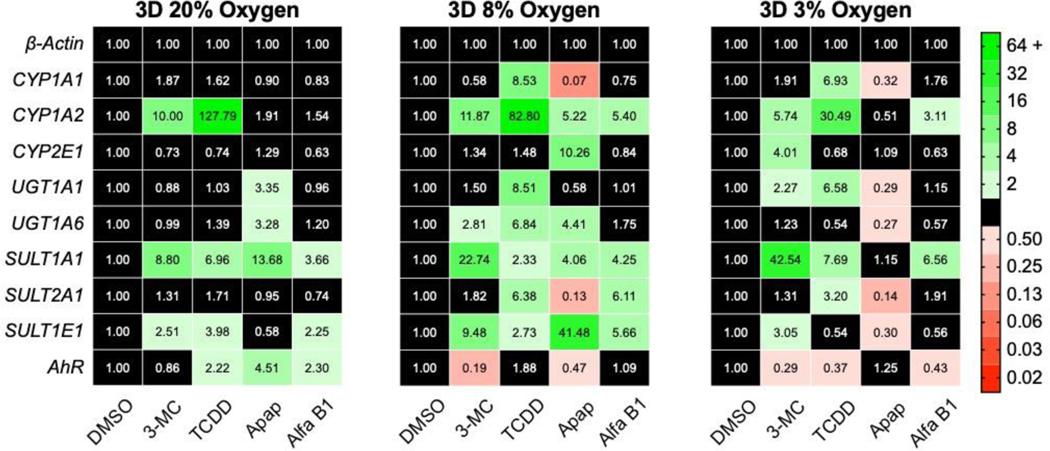
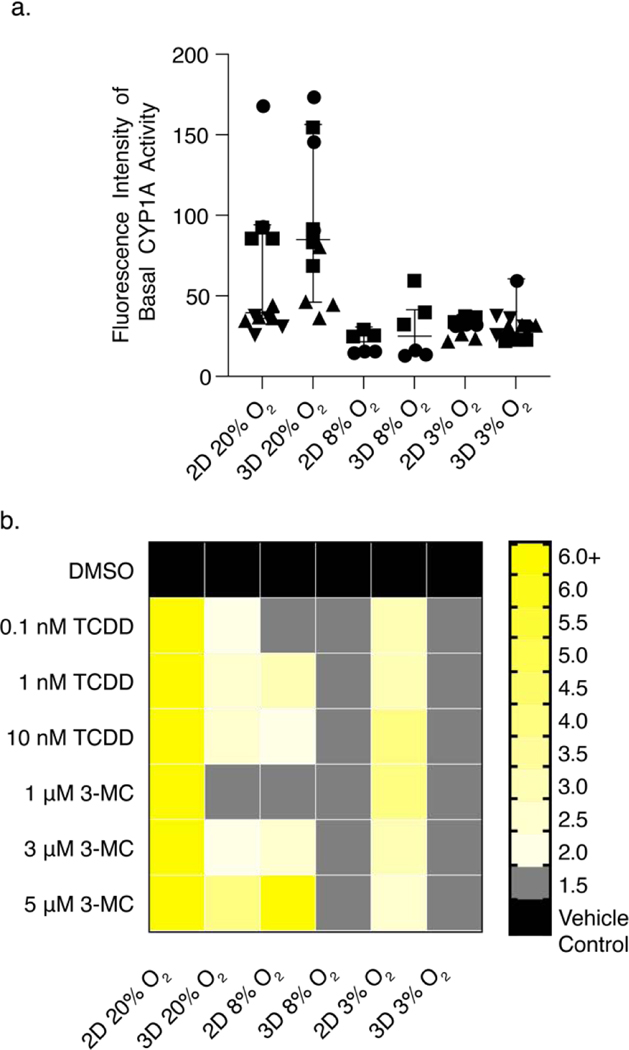
This study evaluates the impact of physiologically relevant oxygen tensions on the response of HepG2 cells to known inducers and hepatotoxic drugs. We compared transcriptional regulation and CYP1A activity after a 48 h exposure at atmospheric culture conditions (20% O2) with representative periportal (8% O2) and perivenous (3% O2) oxygen tensions. We evaluated cellular responses in 2D and 3D cultures at each oxygen tension in parallel, using monolayers and a paper-based culture platform that supports cells suspended in a collagen-rich environment. Our findings highlight that the toxicity, potency, and mechanism of action of drugs are dependent on both culture format and oxygen tension. HepG2 cells in 3D environments at physiologic oxygen tensions better matched primary human hepatocyte data than HepG2 cells cultured under standard conditions. Despite altered transcriptional regulation with decreasing oxygen tensions, we did not observe the zonation patterns of drug-metabolizing enzymes found in vivo. Our approach demonstrates that oxygen is an important regulator of liver function but it is not the sole regulator. It also highlights the utility of the 3D paper-based culture platform for continued mechanistic studies of microenvironmental influences on cellular responses.

Keywords: 3D-culture; Acetaminophen; Hepatotoxicity; Liver tissue models; Oxygen.


Figures

Figure 1.
Figure 1.
Experimental workflow comparing the responses of HepG2 cells exposed to different oxygen tensions. Cell monolayers were maintained on standard culture plasticware. The 3D cultures were prepared by seeding cells suspended in a collagen I matrix into wax-patterned paper scaffolds. (a) First, cells were placed in the appropriate culture format and incubated for 24 h at atmospheric culture conditions (20% O2, 5% CO2, and 37 °C). (b) Next, the cells were incubated in the presence of a drug or inducer for 48 h at 20%, 8%, or 3% O2. (c) Finally, cellular responses were quantified. Hepatotoxicity was evaluated with the CellTiter-Glo viability assay, CYP1A activity quantified with the EROD assay, and transcriptional regulation was determined with RT-qPCR.
Figure 2.
Figure 2.
Dose-response relationships of 40,000 HepG2 cells after a 48 h exposure to acetaminophen at atmospheric (20%), periportal (8%), or perivenous (3%) oxygen tensions. Each point is the average and SEM collected from at least two different cell passages (N=2); each pass contained at least three technical replicates (n=3). The black lines connecting the points represent the best-fit 4PL model; the gray shaded regions represent the 95% confidence intervals of those fits.
Figure 3.
Figure 3.
Dose-response relationships of 40,000 HepG2 cells in the 3D culture format after a 48 h exposure to either cyclophosphamide (a-c) or aflatoxin B1 (d-f) at atmospheric (20%), periportal (8%), or perivenous (3%) oxygen tensions. Each point is the average and SEM collected from at least two different cell passages (N=2–3); each pass contained at least three technical replicates (n=3). The black lines connecting the points represent the best-fit 4PL model (cyclophosphamide) and 3-PL model (aflatoxin B1); the gray shaded regions represent the 95% confidence intervals of those fits.
Figure 4.
Figure 4.
Transcript-level regulation of phase I and phase II drug-metabolizing enzymes in HepG2 (a) monolayer and (b) 3D cultures after a 48 h exposure to 20%, 8%, or 3% O2. (c) Transcript-level regulation between monolayer and 3D culture formats at each oxygen tension. Each value is the average of at least two cell passages (N=2–3); each pass contained at least three technical replicates (n=3). A fold-change >2 indicates a significant increase in expression; <0.50 indicates a significant decrease. The numerical values correspond to the average ΔΔCt value of each transcript.
Figure 5.
Figure 5.
Transcript-level regulation of 3D cultures of HepG2 cells after a 48 h incubation with 5 μM 3-MC, 1 nM TCDD, 10 mM acetaminophen (apap), or 10 nM aflatoxin B1 (afla B1). Each value is the fold change of the average ΔΔCt value from at least two cell passages (N=2–3); each pass contained at least three technical replicates (n=3). A fold-change >2 indicates a significant increase in expression; <0.50 indicates a significant decrease. The numerical values correspond to the average ΔΔCt value of each transcript.
Figure 6.
Figure 6.
Average CYP1A activity of HepG2 cells as determined by the EROD assay. (a) Basal CYP1A activity, plotted as the raw fluorescent intensity, after a 48 h incubation. (b) CYP1A activity after a 48 h induction with increasing concentrations of 3-MC or TCDD. Values are the average of at least six data points collected from at least two cell passages (N=2). Each pass contained at least three technical replicates (n=3). A fold-change >2 indicates a significant increase in activity. The numerical values of the heatmap are found in Table S5.

References

    1. Agarwal T, Borrelli M, Makvandi P, Ashrafizadeh M, Maiti T, 2020. Paper-based cell culture: Paving the pathway for liver tissue model development on a cellulose paper chip. ACS Appl. Bio Mater 3, 3956–3974. - PubMed
    1. Al-Ani A, Toms D, Kondro D, Thundathil J, Yu T, Ungrin M, 2018. Oxygenation in cell culture: Critical parameters are routinely not reported. PLoS One 13, e0204269. - PMC - PubMed
    1. Audibert G, Saunier C, du Souich P, 1993. In vivo and in vitro effect of cimetidine, inflammation, and hypoxia on propofol kinetics. Drug Metab. Dispos 21, 7–12. - PubMed
    1. Bell C, Lauschke V, Vorrink S, Palmgren H, Duffin R, Andersson T, Ingelman-Sundberg M, 2017. Transcriptional, functional, and mechanistic comparisons of stem cell-derived hepatocytes, HepaRG cells, and three-dimensional human hepatocyte spheroids as predictive in vitro systems of drug-induced liver injury. Drug Metab. Dispos 45, 419–429. - PMC - PubMed
    1. Bowyer C, Lewis A, Lloyd A, Phillips G, Macfarlane W, 2017. Hypoxia as a target for drug combination therapy of liver cancer. Anticancer Drugs 28, 771–780. - PMC - PubMed

MeSH terms

LinkOut - more resources