. 2021 Apr 3;21(1):64.
doi: 10.1186/s12874-021-01237-6.

Deep generative models in DataSHIELD

Affiliations

Deep generative models in DataSHIELD

Stefan Lenz et al. BMC Med Res Methodol. .

Abstract

Background: The best way to calculate statistics from medical data is to use the data of individual patients. In some settings, this data is difficult to obtain due to privacy restrictions. In Germany, for example, it is not possible to pool routine data from different hospitals for research purposes without the consent of the patients.

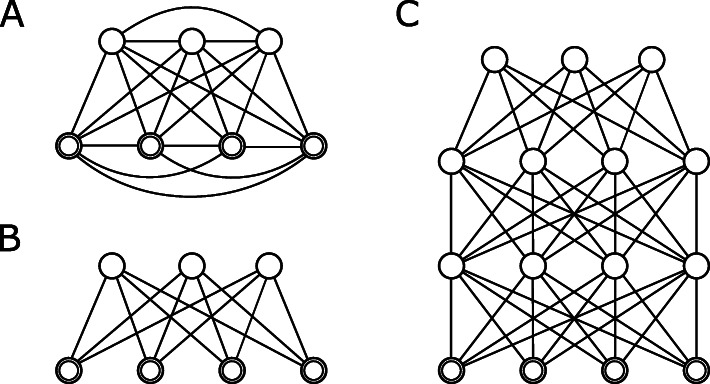
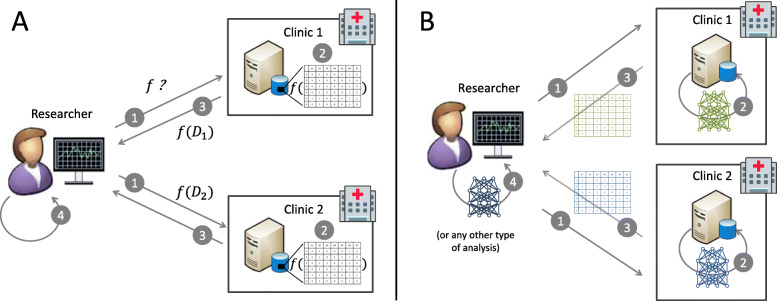
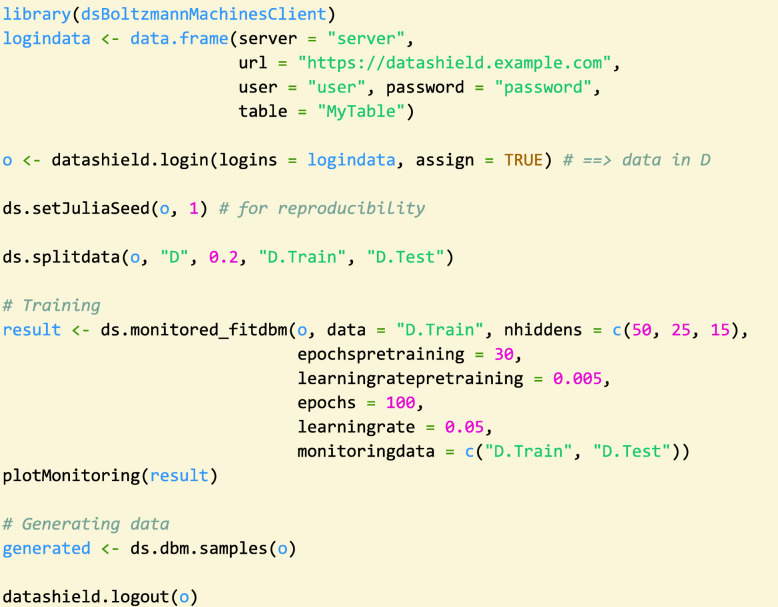
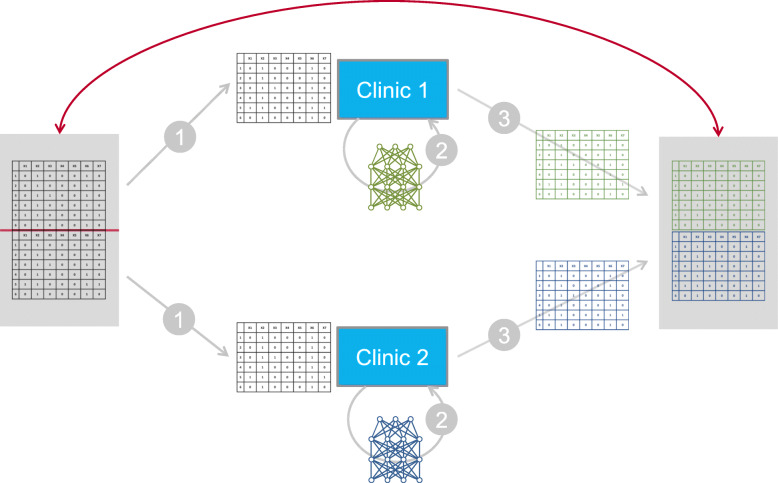
Methods: The DataSHIELD software provides an infrastructure and a set of statistical methods for joint, privacy-preserving analyses of distributed data. The contained algorithms are reformulated to work with aggregated data from the participating sites instead of the individual data. If a desired algorithm is not implemented in DataSHIELD or cannot be reformulated in such a way, using artificial data is an alternative. Generating artificial data is possible using so-called generative models, which are able to capture the distribution of given data. Here, we employ deep Boltzmann machines (DBMs) as generative models. For the implementation, we use the package "BoltzmannMachines" from the Julia programming language and wrap it for use with DataSHIELD, which is based on R.

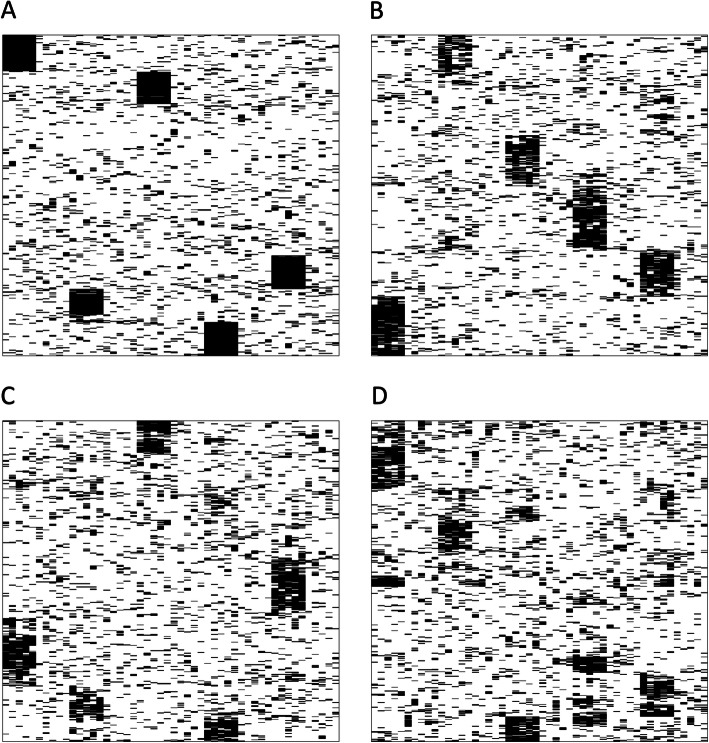
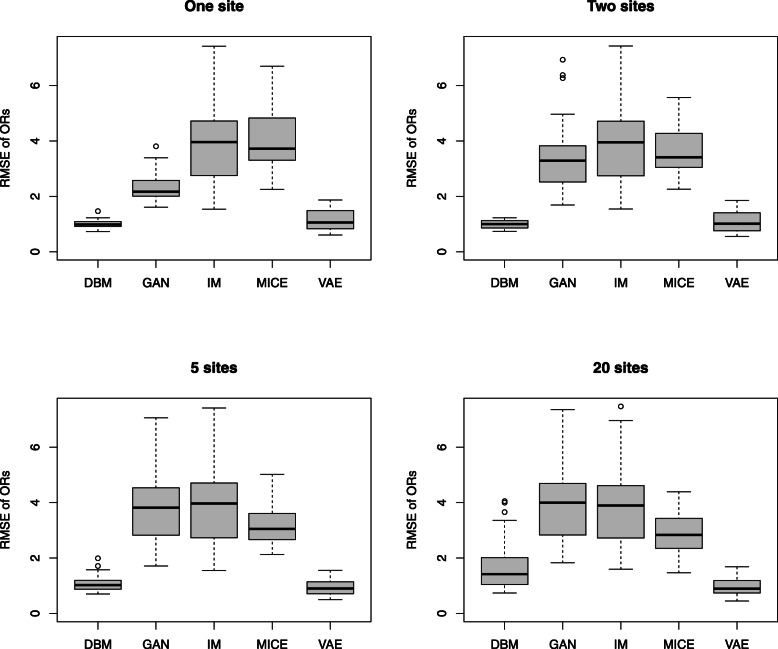
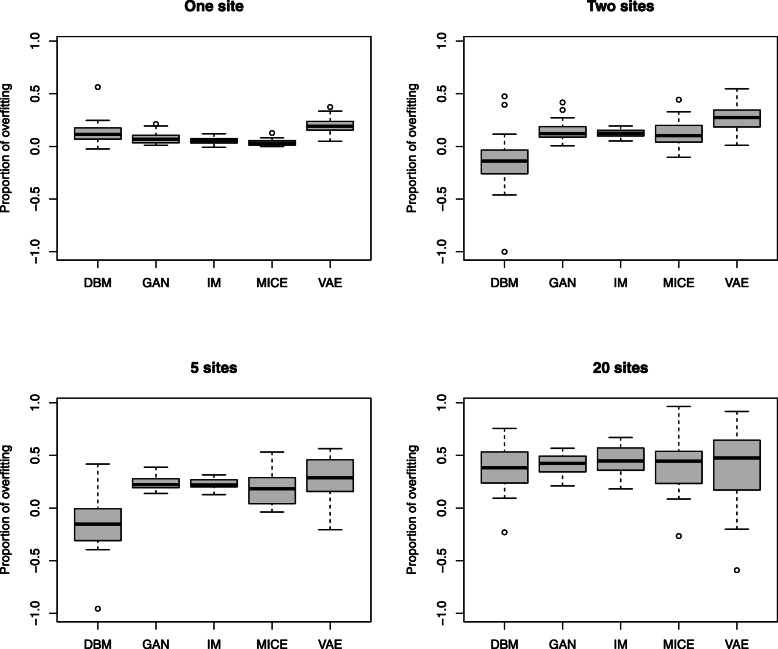
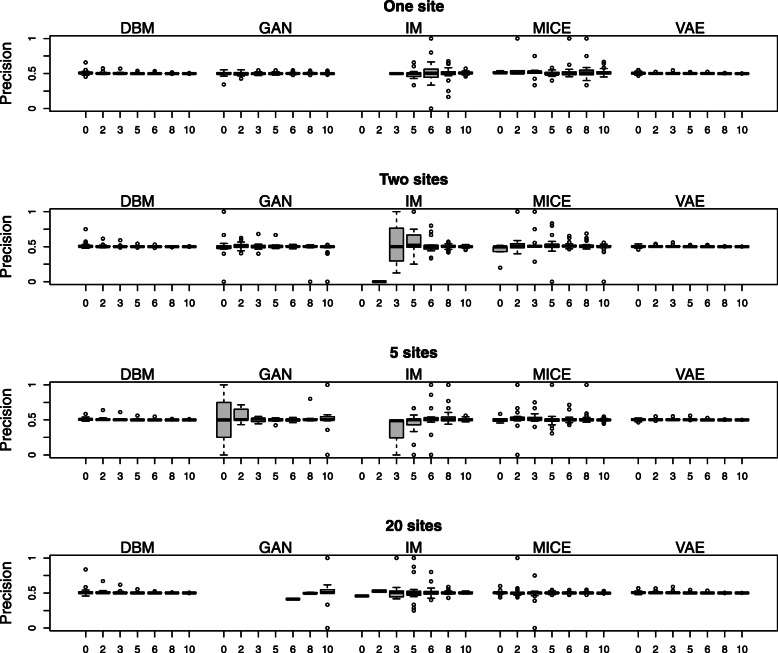
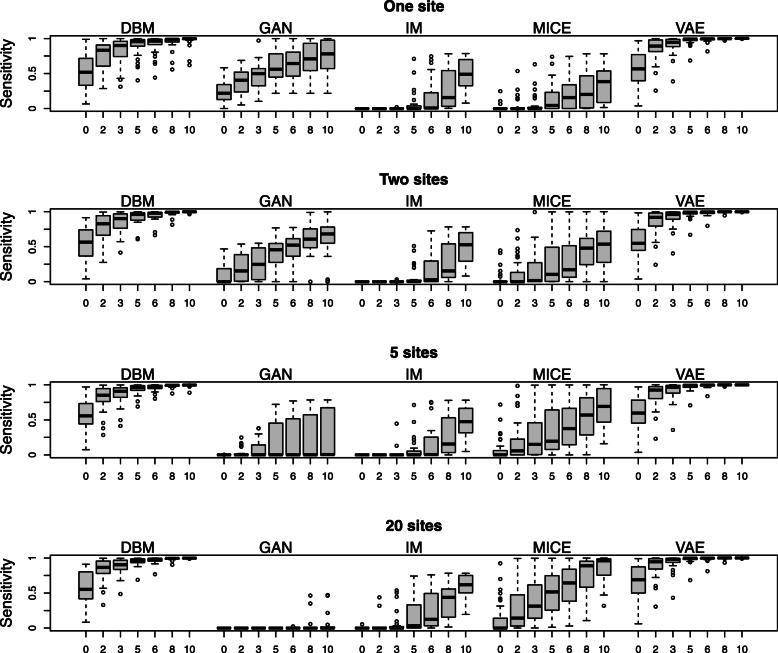
Results: We present a methodology together with a software implementation that builds on DataSHIELD to create artificial data that preserve complex patterns from distributed individual patient data. Such data sets of artificial patients, which are not linked to real patients, can then be used for joint analyses. As an exemplary application, we conduct a distributed analysis with DBMs on a synthetic data set, which simulates genetic variant data. Patterns from the original data can be recovered in the artificial data using hierarchical clustering of the virtual patients, demonstrating the feasibility of the approach. Additionally, we compare DBMs, variational autoencoders, generative adversarial networks, and multivariate imputation as generative approaches by assessing the utility and disclosure of synthetic data generated from real genetic variant data in a distributed setting with data of a small sample size.

Conclusions: Our implementation adds to DataSHIELD the ability to generate artificial data that can be used for various analyses, e.g., for pattern recognition with deep learning. This also demonstrates more generally how DataSHIELD can be flexibly extended with advanced algorithms from languages other than R.

Keywords: Biomedical research/methods; Deep learning; Distributed system; Privacy/statistics and numerical data.


Conflict of interest statement

The authors declare that they have no competing interests.

Figures

Fig. 1
Fig. 1
Overview of different types of Boltzmann machines. The visible nodes are depicted as doubled circles, hidden nodes are single circles. a: General Boltzmann machine, with all nodes connected to each other. b: Restricted Boltzmann machines, with two layers of nodes. c: Deep belief network (DBN) or deep Boltzmann machine (DBM), consisting of multiple layers. The architecture of DBNs and DBMs is the same but the algorithms for training and sampling are different
Fig. 2
Fig. 2
Applying the DataSHIELD principle in working with synthetic data from generative models. The standard DataSHIELD approach is depicted in panel a: The researcher sends a request via the DataSHIELD infrastructure (1). The sites then calculate aggregated statistics (2) and return them to the researcher (3). These statistics do not allow conclusions about individual patients, but can be used to derive useful information about the population (4). When working with generated models and synthetic data (panel b), the workflow is similar. The researcher requests the training of a generative model (1). Once the model has been trained on the server side with access to the individual-level data (2), synthetic samples can be generated (3). The researcher can use the synthetic data to conduct further analyses (4)
Fig. 3
Fig. 3
Example code for training a deep Boltzmann machine and using it as a generative model. First, the user needs to log in to the Opal server, where the data is stored. If the specified data set is available, and the user has the correct access rights, the data set is loaded into the R session. The loaded data can be split into training and test data before the training. In the subsequent call to the fitting function, which by default also collects monitoring data from the training, the most important parameters for training a DBM are included. The numbers of hidden nodes for each of the hidden layers (“nhiddens”) determine the model architecture. The learning rate and the number of epochs for pre-training and fine-tuning of the DBM are the most important parameters for the optimisation procedure. If a good solution has been found, the model can be used to generate synthetic data and return it to the client
Fig. 4
Fig. 4
Sketch of the experimental setup for the comparison of original and generated data. In the first step, the original data is split into a number of smaller data sets, which are distributed in equal shares, consisting of consecutive parts of the data set, to the virtual sites. (For simplicity, only two sites/clinics are shown.) In step 2, separate generative models are trained at each site on their share of the data. In step 3, synthetic data are generated by each of the models and compiled to again form one overall data set. This synthetic data set will be visually compared to the original data set. For the results, see Fig. 5 below
Fig. 5
Fig. 5
Hierarchical clustering view of a data set and associated synthetic data sets. The rows are the patients and the columns are the variables. The rows are clustered hierarchically [34]. Panel a shows the original data set, panel b shows data generated from one DBM that has been trained on the original data. Panels c and d show outputs of the experiment conducted with 2 and 20 sites, respectively. The SNP sets with the five consecutive 1s appear as black blocks in the hierarchical clustering view. The vertical positions of the black blocks change across the different sub plots because the noise in the other variables also influences the clustering. The horizontal position of the blocks, which is determined by the position of the genetic features, is the same in all four plots
Fig. 6
Fig. 6
Performance comparison of the different model types based on odds ratios. The performance is quantified by the distance (rooted mean squared error) between log odds ratios computed from generated samples and validation data. Each model is evaluated on the same 30 different data sets. Each of the 30 data sets contains genetic variation data from 50 SNPs from randomly selected genetic locations. As shown in Fig. 4, the original data sets with 500 samples (chromosomes) are equally split into two, five and 20 sites, respectively. Results are shown for the combined generated data sets collected from the sites
Fig. 7
Fig. 7
Proportions of overfitting in the models. Overfitting is indicated by a reduction in the distance of the log odds between generated data and the training data relative to the validation data. (See formula (1) in the methods section for a formal definition.) Positive values indicate overfitting, while negative values indicate that the approach performed actually better on the validation data than on the training data. All data points shown relate to the same data and model configurations that produced the results in Fig. 6
Fig. 8
Fig. 8
Precisions of distance-based membership attacks. The numbers on the x-axes indicate the Hamming distances. All data points correspond to the same data and model configurations that produced the results in Fig. 6
Fig. 9
Fig. 9
Sensitivities of distance-based membership attacks. Same as in Fig. 8, the numbers on the x-axes indicate the Hamming distances, and all data points correspond to the same data and model configurations that produced the results in Fig. 6

References

    1. Prokosch H-U, Acker T, Bernarding J, Binder H, Boeker M, Boerries M, et al. MIRACUM: Medical Informatics in Research and Care in University Medicine. Methods Inf Med. 2018;57 S 1:e82–91. - PMC - PubMed
    1. Nowok B, Raab GM, Dibben C. Synthpop: bespoke creation of synthetic data in R. J Stat Softw. 2016;74:1–26. doi: 10.18637/jss.v074.i11. - DOI
    1. Manrique-Vallier D, Hu J. Bayesian non-parametric generation of fully synthetic multivariate categorical data in the presence of structural zeros. J R Stat Soc Ser A Stat Soc. 2018;181:635–647. doi: 10.1111/rssa.12352. - DOI
    1. Quick H, Holan SH, Wikle CK. Generating partially synthetic geocoded public use data with decreased disclosure risk by using differential smoothing. J R Stat Soc Ser A Stat Soc. 2018;181:649–661. doi: 10.1111/rssa.12360. - DOI
    1. Statice GmbH. Company web site. https://www.statice.ai/. Accessed 27 Aug 2019.

Publication types

LinkOut - more resources