

How do pollutants change post-pandemic? Evidence from changes in five key pollutants in nine Chinese cities most affected by the COVID-19
- PMID: 33812870
- PMCID: PMC8545702
- DOI: 10.1016/j.envres.2021.111108
How do pollutants change post-pandemic? Evidence from changes in five key pollutants in nine Chinese cities most affected by the COVID-19
Abstract
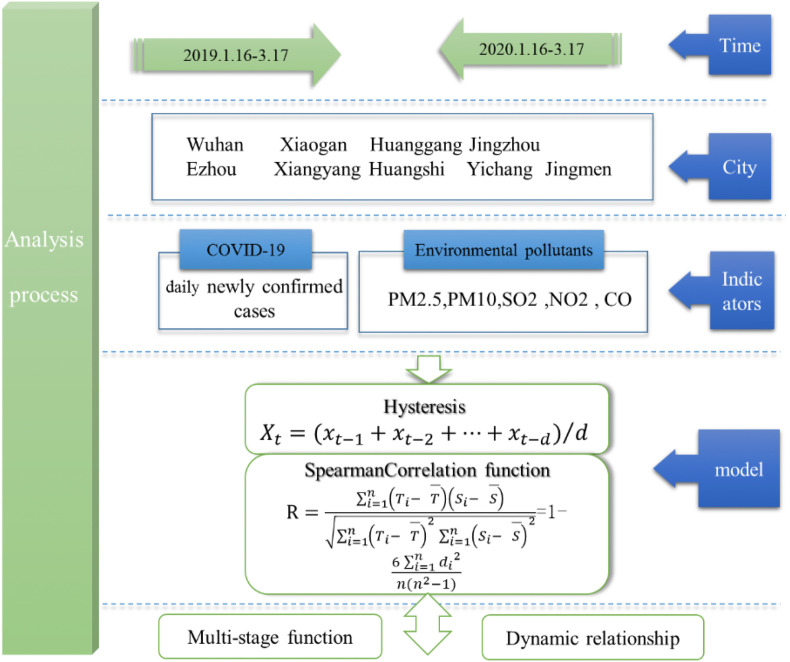
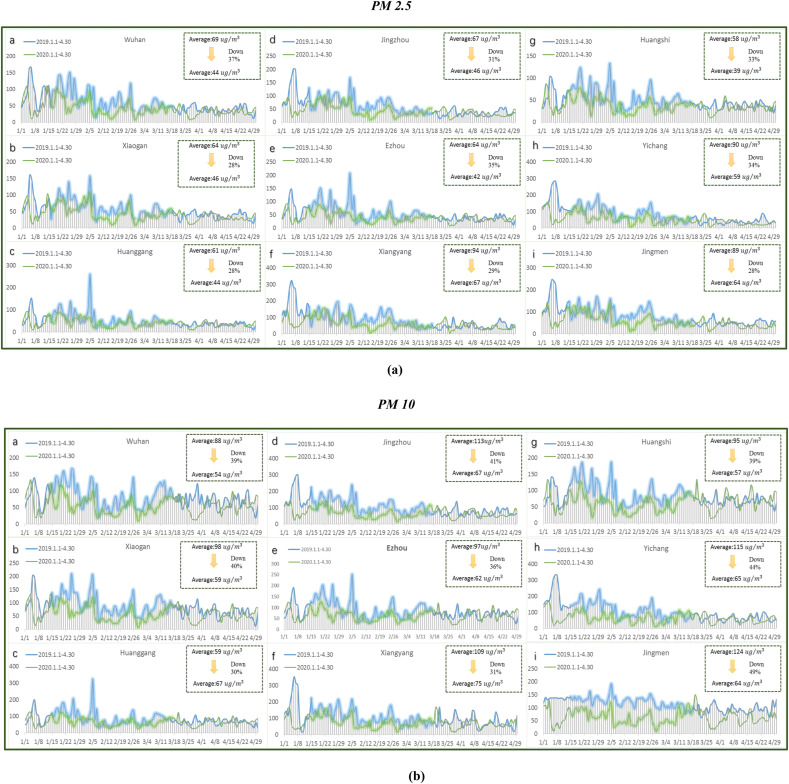
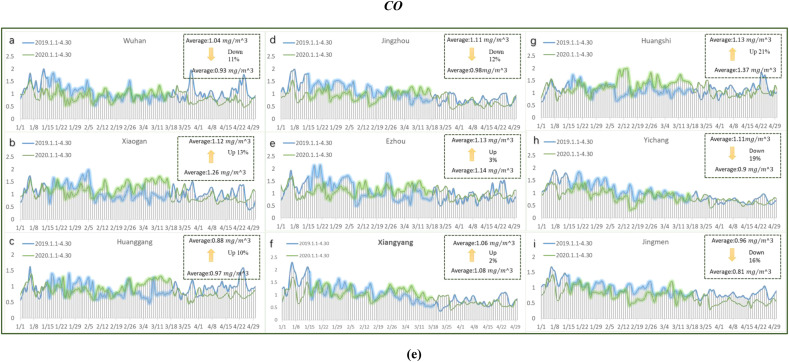
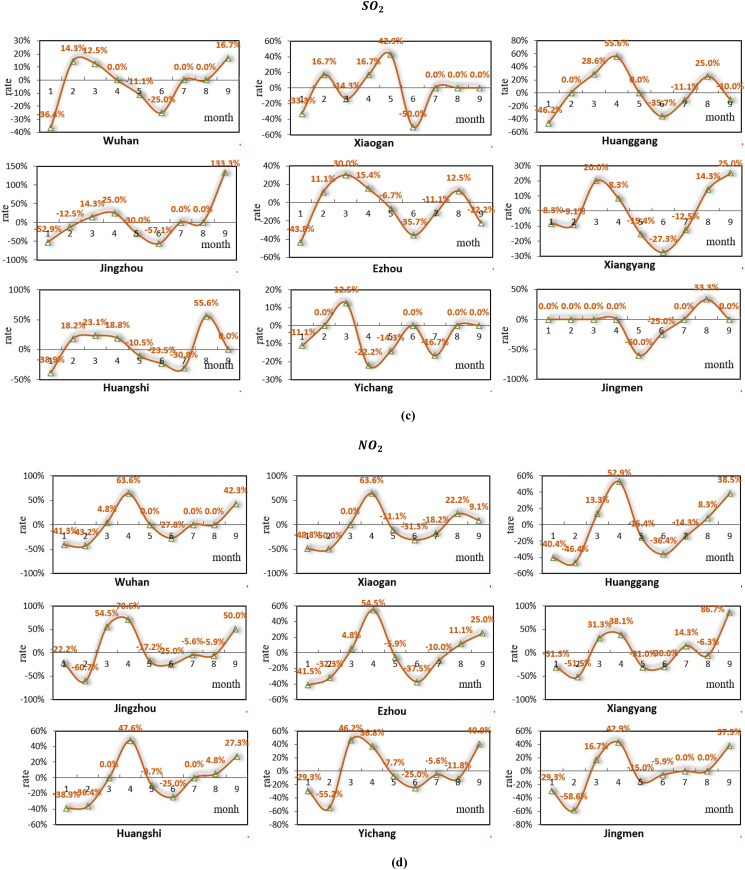
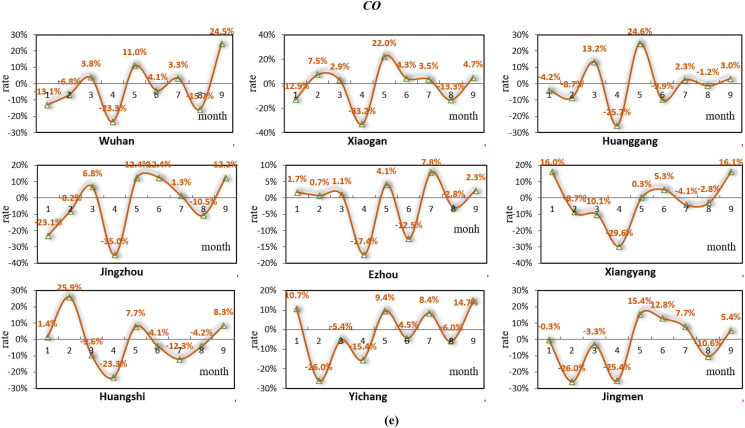
Under the COVID-19 global pandemic, China has weakened the large-scale spread of the epidemic through lockdown and other measures. At the same time, with the recovery of social production activities, China has become the only country which achieves positive growth in 2020 in the major economies. It entered the post pandemic period. These measures improved the local environmental quality. However, whether this improvement can be sustained is also a problem that needs to be solved. So, this study investigated the changes of five air pollutants (PM2.5, PM10, NO2, SO2, and CO) in the nine cities most severely affected by the pandemic in China during the lockdown and post pandemic period. We emphasized that when analyzing the changes of environmental quality during the epidemic, we must consider not only the impact of the day and short-term changesbut also the cumulative lag effect and sustainable development. Through a combination of qualitative and quantitative methods, it is found that the concentration of pollutants decreased significantly during the lockdown compared to the situation before the epidemic. PM10 and NO2 are falling most, which downs 39% and 46% respectively. During the lockdown period, the pollutant concentrations response to the pandemic has a lag of 3-7 days. More specifically, in the cities related to single pollutants, the impact on the pollutant shows a significant correlation when the measures are delayed for seven days. In the cities that are related to multiple pollutants, the correlation is usually highest in 3-5 days. This means that the impact of policy measures on the environment lasted for 3-5 days. Besides, Wuhan, Jingmen and Jingzhou have seen the most obvious improvement. However, this improvement did not last. In the post pandemic period, the pollutants rebounded, the growth rates of PM10 and NO2 reached 44% and 87% in September. When compared with the changes of pollutants concentration in the same period from 2017 to 2019, the decline rate has also been significantly slower, even higher than the average concentration of previous years. The research not only contributes to China's economic "green recovery" plan during the post epidemic period, but also provides references for environmental governance during economic recovery in other countries.
Keywords: Air pollution; Hysteresis; Lockdown; Post pandemic period; Rebound.
Copyright © 2021 Elsevier Inc. All rights reserved.
Conflict of interest statement
The authors declare that they have no known competing financial interests or personal relationships that could have appeared to influence the work reported in this paper.
Figures


References
-
- Abou El-Magd I., Zanaty N. Impacts of short-term lockdown during COVID-19 on air quality in Egypt. Egypt. J. Rem. Sens. Space Sci. 2020 doi: 10.1016/j.ejrs.2020.10.003. In press. - DOI
-
- Balasubramaniam D., et al. 2020. Assessing the Impact of Lockdown in US, Italy and France– what Are the Changes in Air Quality? Energy Sources, Part A: Recovery, Utilization, and Environmental Effects; pp. 1–11.
Publication types
MeSH terms
Substances
LinkOut - more resources
Full Text Sources
Other Literature Sources
Medical
