. 2021 Jun 1:111-112:1-13.
doi: 10.1016/j.niox.2021.03.005. Epub 2021 Apr 1.

TRPC channel-derived calcium fluxes differentially regulate ATP and flow-induced activation of eNOS

Affiliations

TRPC channel-derived calcium fluxes differentially regulate ATP and flow-induced activation of eNOS

Tenderano T Muzorewa et al. Nitric Oxide. .

Abstract

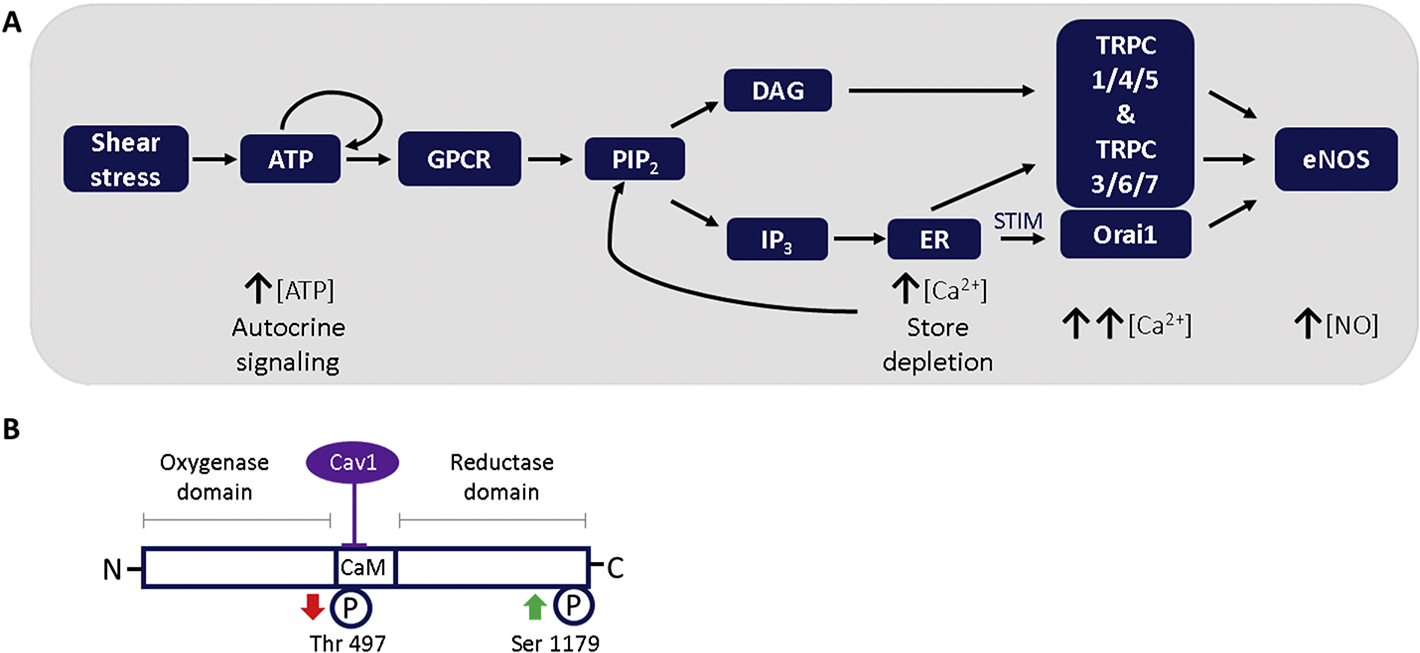
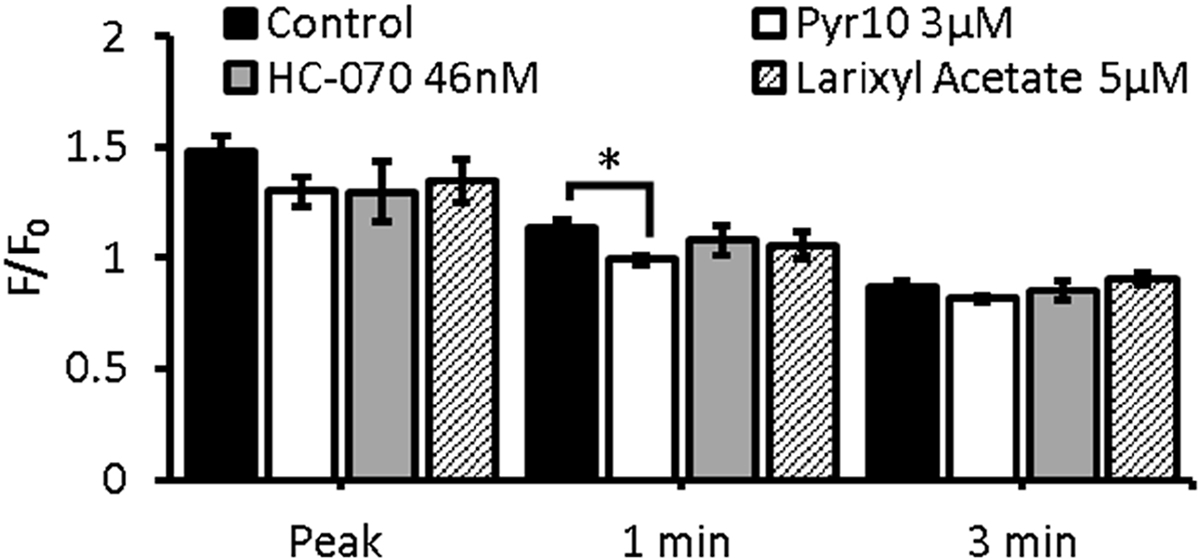
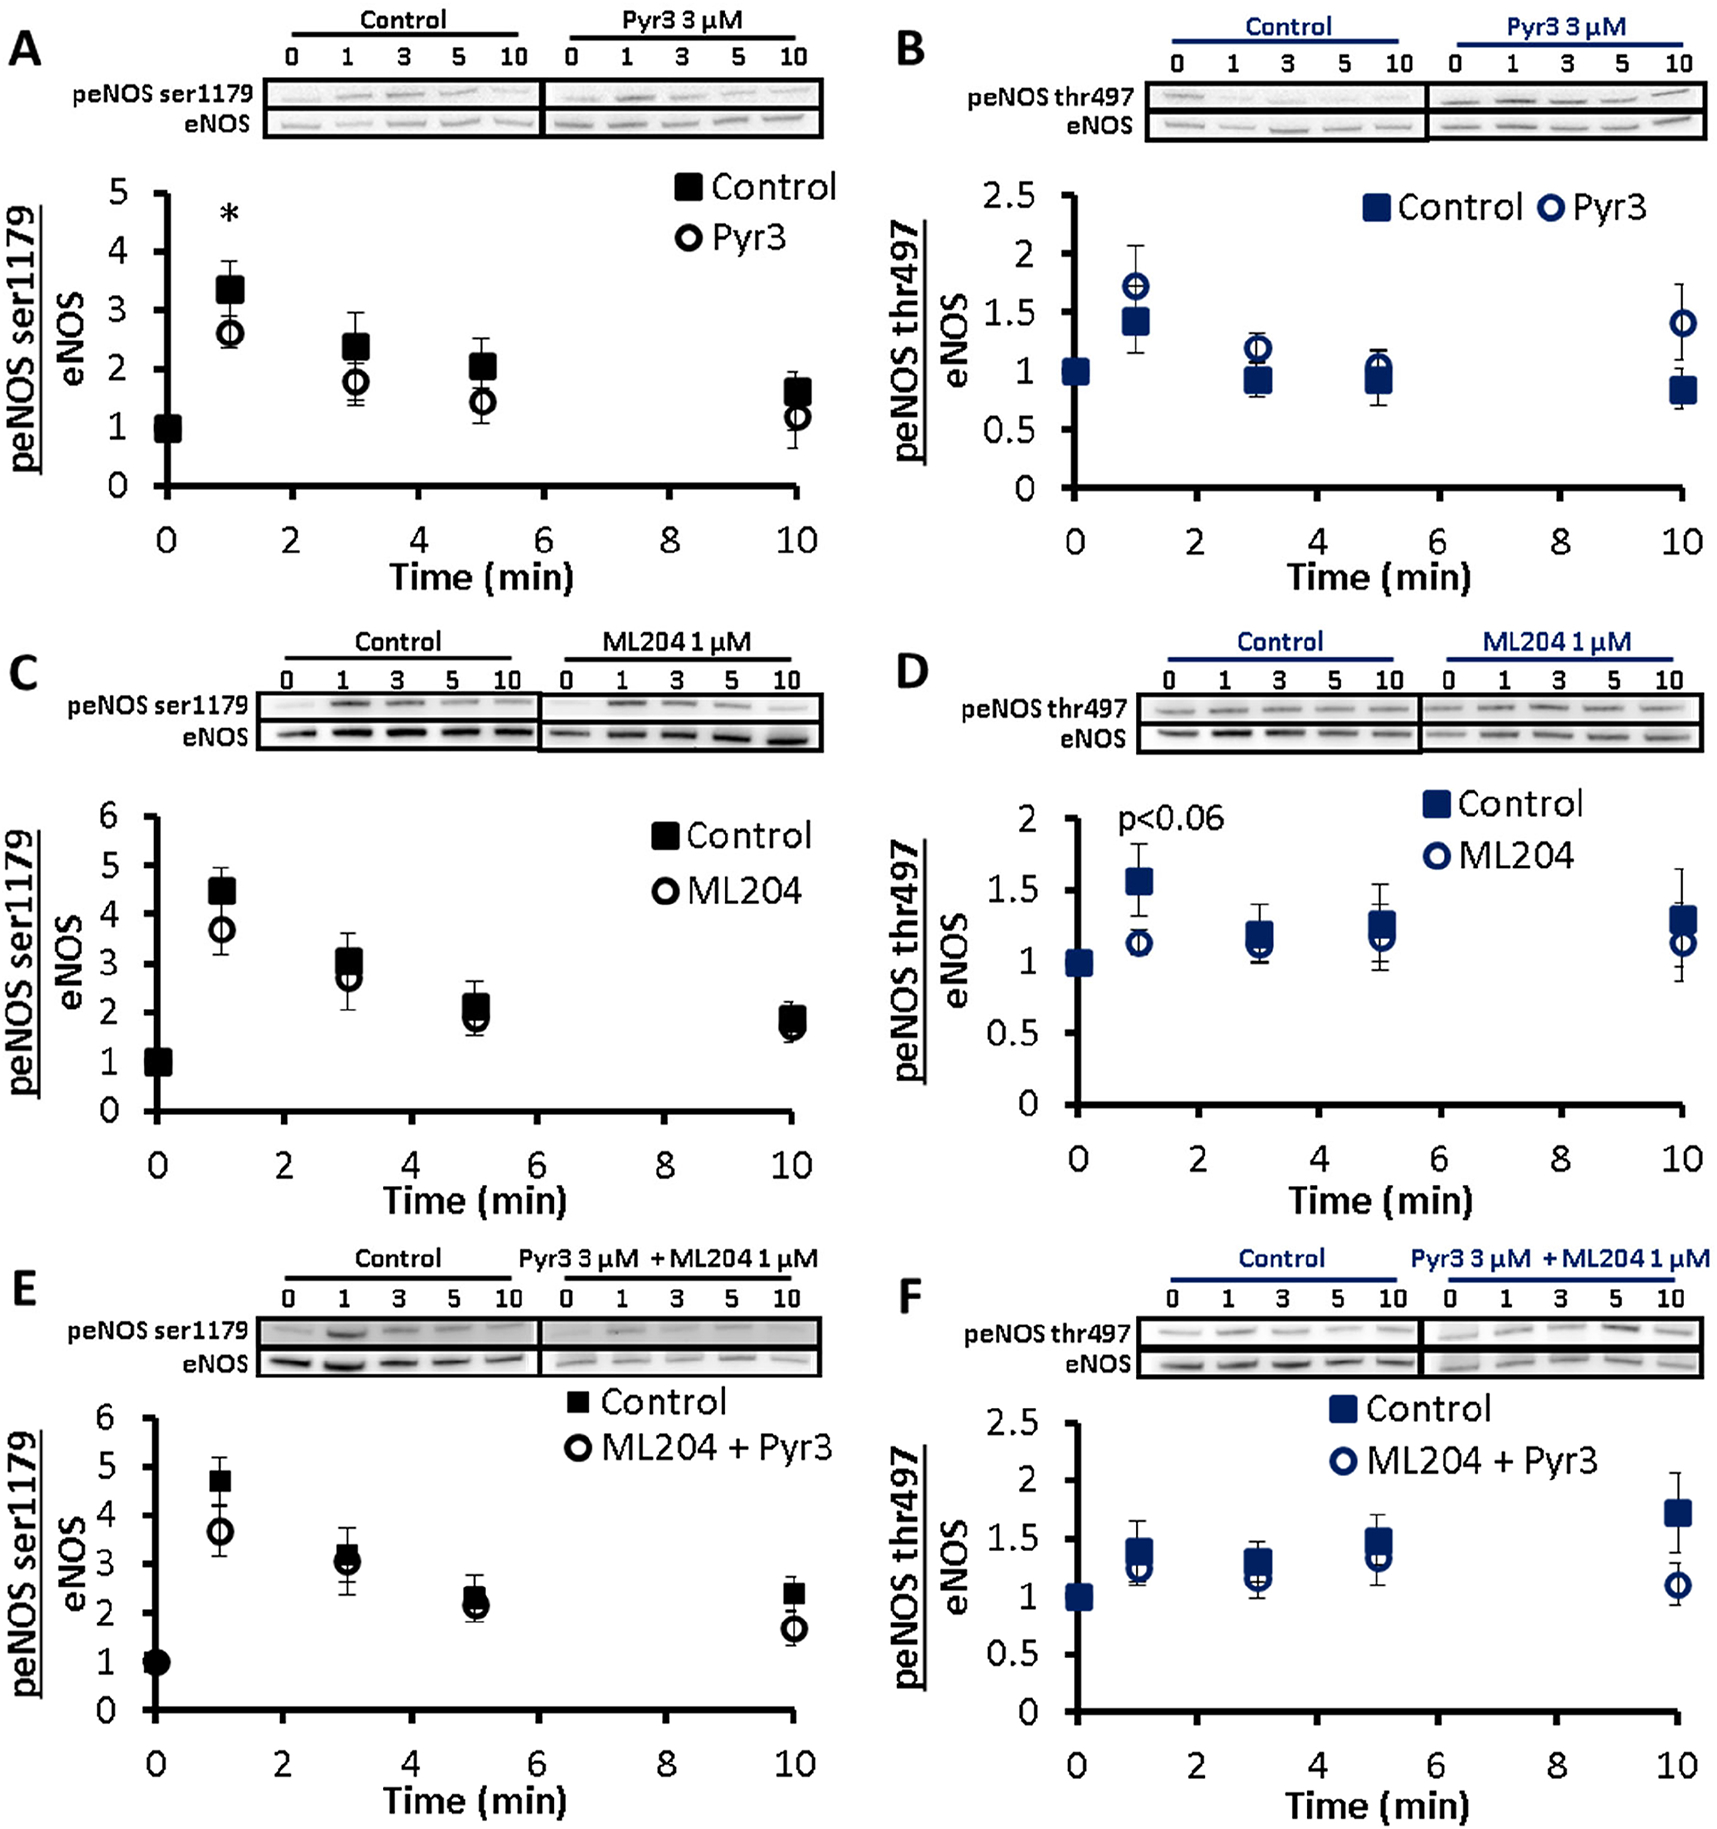
Endothelial dysfunction, characterised by impaired nitric oxide (NO) bioavailability, arises in response to a variety of cardiovascular risk factors and precedes atherosclerosis. NO is produced by tight regulation of endothelial nitric oxide synthase (eNOS) activity in response to vasodilatory stimuli. This regulation of eNOS is mediated in part by store-operated calcium entry (SOCE). We hypothesized that both ATP- and flow-induced eNOS activation are regulated by SOCE derived from Orai1 channels and members of the transient receptor potential canonical (TRPC) channel family. Bovine aortic endothelial cells (BAECs) were pre-treated with pharmacological inhibitors of TRPC channels and Orai1 to examine their effect on calcium signaling and eNOS activation in response to flow and ATP. The peak and sustained ATP-induced calcium signal and the resulting eNOS activation were attenuated by inhibition of TRPC3, which we found to be store operated. TRPC4 blockade reduced the transient peak in calcium concentration following ATP stimulation, but did not significantly reduce eNOS activity. Simultaneous TRPC3 & 4 inhibition reduced flow-induced NO production via alterations in phosphorylation-mediated eNOS activity. Inhibition of TRPC1/6 or Orai1 failed to lower ATP-induced calcium entry or eNOS activation. Our results suggest that TRPC3 is a store-operated channel in BAECs and is the key regulator of ATP-induced eNOS activation, whereas flow stimulation also recruits TRPC4 into the pathway for the synthesis of NO.

Keywords: Calcium; Nitric oxide; Orai1; Store-operated; TRPC.


Figures

Figure 1
Figure 1
A: Schematic of hypothesized flow-induced eNOS activation regulated by TRPC- and ORAI - mediated SOCE. Shear stress induces autocrine ATP release. ATP activates PLC via G-protein receptors allowing PLC to hydrolyze PIP2 to form DAG and IP3. IP3 diffuses and binds to receptors on the endoplasmic reticulum (ER) causing store depletion which activates SOCs. DAG promotes opening of TRPCs. The increase in intracellular calcium allows for Ca2+/Calmodulin-mediated eNOS activation which leads to NO production. B: Key regulatory sites of endothelial nitric oxide synthase. The inhibitory Cav1 binding site in the calcium/calmodulin binding domain is shown. Phosphorylation sites are numbered according to the bovine eNOS sequence. The arrows indicate the effect of phosphorylation on eNOS activity. Phosphorylation of Ser1179 increases eNOS activity, whereas phosphorylation of Thr497 is inhibitory. Cav1-caveolin1, Ser—serine, Thr—threonine, CaM—calmodulin.
Fig. 2.
Fig. 2.
Expression of orai1 and TRPC variants in BAECs. Untreated BAECs were lysed and probed by western blotting for orai1 and TRPC 1,3,4,& 6 alongside positive controls MCF-7 whole cell lysate, and Jurkat whole cell lysate. All proteins appeared at or near predicated molecular weights: orai1 ~ 38/50 kDa, TRPC1 ~88 kDa, TRPC3 ~97/106/100 kDa, TRPC4 ~110 kDa, and TRPC6 ~106 kDa.
Figure 3:
Figure 3:
Effect of TRPC3 and TRPC4 inhibition on ATP-induced calcium entry. BAECs were preincubated with PBS for 30min (control)-black, TRPC3 inhibitor Pyr3 (A,B), TRPC4 inhibitor ML204 (C,D), or a combination of Pyr3 & ML204 (E,F) –grey then stimulated with 100μM ATP. A,C,E: Averaged traces of ATP-induced calcium fluorescence (F) normalized to baseline fluorescence (F0) B,D,F: Bar graph depicting relative calcium fluorescence at the peak of the calcium transient as well as at 1min and 3min of ATP stimulation. Results are reported as mean ± S.E.M., * p<0.05, ** p<0.01, *** p<0.001, Control & Pyr3 n= 14,17 Control & ML204 n=14, 20, Control & Pyr3+ML204 n=6, 10.
Figure 4:
Figure 4:
Effect of TRPC1/6 and ORAI1 inhibition on ATP-induced calcium entry. BAECs were preincubated with PBS for 30min (control)-black, TRPC1/6 inhibitor GsMTx4 (A,B) or Orai1 inhibitor AnCoA4 (C,D) –grey then stimulated with 100μM ATP. A,C: Averaged traces of ATP-induced calcium fluorescence (F) normalized to baseline fluorescence (F0). B,D: Bar graph representing relative calcium fluorescence at the peak of the calcium transient as well as at 1 min and 3 min of ATP stimulation. There is no significant difference between the calcium signals. Results are shown as mean ± S.E.M., Control & GsMTx4 n=9, 8, Control & AnCoA4 n=5, 7.
Figure 5
Figure 5
Effect of TRPC3,TRPC4 and TRPC6 inhibition on ATP-induced calcium entry. BAECs were preincubated with PBS for 30min (control)-black, TRPC3 inhibitor Pyr10 (white), TRPC4 inhibitor HC-070 (grey), or TRPC6 inhibitor, larixyl acetate(hatched) then stimulated with 100μM ATP. Bar graph depicts calcium fluorescence (F) normalized to baseline fluorescence (F0) at the peak of the calcium transient as well as at 1min and 3min of ATP stimulation. Results are reported as mean ± S.E.M., * p<0.05, Control n=17, PYr10 n=5, HC-070 n=, Larixyl Acetate n=4.
Figure 6:
Figure 6:
Time to peak calcium fluorescence. Graphs indicate the length of the interval between ATP stimulation and peak calcium fluorescence. Cells were stimulated with 100μM ATP following pretreatment. A: Mean time to peak (t) for ATP-induced calcium entry in control group. B: Bar graph indicates normalized time to peak for PBS (control), TRPC3 inhibitor Pyr3, TRPC4 inhibitor ML204, a combination of Pyr3 + ML204, TRPC1/6 inhibitor GsMTx4 or Orai1 inhibitor AnCoA4. TRPC3 inhibition significantly shortened the time to peak as did TRPC1/6 inhibition. Inhibition of TRPC4 prolonged the time to peak significantly while combined TRPC3 & TRPC4 inhibition did not affect the mean time to peak. TRPC1/6 inhibition produced a significant reduction in the time to peak while Orai1 inhibition had no effect. Results are shown as mean ± S.E.M., * p<0.05, ** p<0.01. Control & Pyr3 n=14,13, Control & ML204 n=14,19, Control & Pyr3 + ML204 n=6,10, Control & GxMTx4 n=9,8, Control & AnCoA4 n=4,4.
Figure 7
Figure 7
Store-dependence of TRPC channels. Dye-loaded BAECs were preincubated with PBS for 30min (control), TRPC3 inhibitor Pyr3 (A,B) or TRPC4 inhibitor ML204 (A,C), then stimulated with 1μM Tg without calcium, followed by a calcium add-back phase (A-C). A: Representative traces of Tg-induced store-operated calcium fluorescence (F) normalized to baseline fluorescence (F0). B,C: Graph depicting peak calcium fluorescence. TRPC3 inhibition significantly diminished the peak calcium while TRPC4 did not produce a significant effect. Results are reported as mean ± S.E.M., ** p<0.01, Control & Pyr3 n= 13,8, Control & ML204 n=7,5.
Figure 8
Figure 8
Basal eNOS-ser1179 phosphorylation following channel inhibition. BAECs were treated for 30 min with PBS with calcium (control) or Pyr3, ML204, Pyr3 + ML204, GsMTX4 and AnCoA4 (TRPC3, TRPC4, TRPC3&4, TRPC1,6 and Orai1 inhibitors respectively) and eNOS-ser1179 and eNOS-th497 phosphorylation was assessed by western blotting. (A) Western blot of basal eNOS phosphorylation following channel inhibition. (B) Graph shows relative eNOS phosphorylation. There were no significant differences in eNOS phosphorylation produced by drug pretreatment compared to the PBS control. Results are shown as mean peNOS/eNOS ± S.E.M., * p<0.05. peNOS ser1179 & peNOS thr497 n=9,5.
Fig. 9.
Fig. 9.
Effect of TRPC3 & TRPC4 inhibition on ATP-induced eNOS activation. BAECs were preincubated with PBS for 30 min (control)-solid square, TRPC3 inhibitor Pyr3 (A,B), TRPC4 inhibitor ML204 (C,D), or a combination of Pyr3 + ML204 (E,F) – open circle. Cells were stimulated with 100 μM ATP for 0 (no ATP),1,3,5 and 10 min and assessed via western blotting. A,C,E: Exemplar western blot and p-eNOS ser1179 normalized to eNOS. B,D,F: Exemplar western blot and p-eNOS thr497 normalized to eNOS. All peNOS/eNOS ratios are normalized to t = 0. Results are reported as mean ± S.E.M., *p < 0.05, Control & Pyr3 n = 6, 7, Control & ML204 n = 6, 7, Control & Pyr3 + ML204 n = 6, 7.
Figure 10
Figure 10
Effect of TRPC1/6 & Orai1 inhibition on ATP-induced eNOS activation. BAECs were preincubated with PBS for 30min (control), TRPC1/6 inhibitor GsMTx4 (A,B) or Orai1 inhibitor AnCoA4 (C,D). Cells were stimulated with 100μM ATP for 0 (no ATP),1,3,5 and 10 min and assessed via western blotting. A,C: Exemplar western blot and p-eNOS ser1179 normalized to eNOS B,D: Exemplar western blot and p-eNOS thr497 normalized to eNOS. All peNOS/eNOS ratios are normalised to t=0. There was a significant suppression in ATP-induced eNOS-thr497 phosphorylation at all time points under TRPC1/6 inhibition. Results are shown as mean ± S.E.M., * p<0.05, ** p<0.01. Control & GsMTx4 n=5, 4, Control & AnCoA4 n=4, 4.
Figure 11
Figure 11
Effect of TRPC3, TRPC4 & TRPC6 inhibition on ATP-induced eNOS activation. BAECs were preincubated with PBS for 30min (control), TRPC3 inhibitor Pyr10, TRPC4 inhibitor HC-070, or TRPC6 inhibitor, larixyl acetate. Cells were stimulated with ATP for 0 (no ATP) or 1min and assessed via western blotting (A). peNOS ser1179 and peNOS thr497 are normalized to eNOS. All peNOS/eNOS ratios are normalised to t=0 (B). Results are reported as mean ± S.E.M.,*** p<0.001, Control n= 13,12, Pyr10 n= 6,6, HC-070 n=10,9, larixyl acetate n=10,7.
Figure 12
Figure 12
Flow-induced calcium and nitric oxide readings. BAECs were treated for 30 min with PBS with calcium (control)-black (B-F), (B) Pyr3, (C) ML204, (D) Pyr3 + ML204, (E) GsMTX4 or (F) AnCoA4 -grey then exposed to 3 min of 10dyn/cm2 shear stress. A: Graph depicts relative calcium fluorescence (F/F0) at the peak of the calcium transient. B-F: Traces represent readings from single experiment, with 10s of baseline readings before onset of flow. Bars represent mean ± S.E.M., ns., n=4.
Figure 13
Figure 13
Flow-induced NO production and eNOS phosphorylation. BAECs were treated for 30 min with PBS (control), Pyr3, ML204, Pyr3 + ML204, GsMTX4 or AnCoA4 before temperature equilibration in the flow chamber and onset of 3min of 10 dyn/cm2 shear. Cells were lysed and eNOS phosphorylation assessed by western blotting. A: Bar graph showing peak change in NO concentration and Δ[NO] following 1 min and 3 min of flow. Combined Pyr3 + ML204 inhibition significantly suppressed NO production and produced further reduction in Δ[NO] than application of TRPC4 inhibitor alone. B: Western blots of eNOS phosphorylation following calcium inhibition under static and flow conditions. C: peNOS ser1179/eNOS in static and sheared cells. GsMTx4 pretreatment significantly reduced flow induced eNOS-ser1179 phosphorylation compared to static group. D: peNOS thr497/eNOS in static and sheared cells. Pyr3 and combined Pyr3 + ML204 pretreatment significantly increased eNOS-thr497 phosphorylation in sheared cells compared to static group. Results are shown as mean ± S.E.M., * p<0.05, ** p<0.01, Flow: Control n=9, Pyr3 n=9, ML204 n=7, Pyr3 & ML204 n=7, GxMTx4 n=6, AnCoA4 n=7, phosphorylation: static & flow n=4,5.
Figure 14
Figure 14
Summary of the flow- and ATP-induced eNOS activation pathway. Shear stress induces autocrine ATP release. ATP activates PLC via G-protein receptors allowing PLC to hydrolyze PIP2 to form DAG and IP3. IP3 diffuses and binds to receptors on the endoplasmic reticulum (ER) causing store depletion which activates the SOC TRPC3 and (putatively) Orai1. DAG promotes opening of store-independent TRPC4s. There is a combined effect of TRPC3 and TRPC4 activation. The increase in intracellular calcium allows for Ca2+/Calmodulin-mediated eNOS activation which leads to NO production regulated by TRPC3- and TRPC4- mediated calcium entry. We deduced that ATP-independent recruitment of TRPC4 occurs in response to flow. The participation of Orai1 in this pathway is unclear (grey dotted line).

References

    1. Bredt DS, Endogenous nitric oxide synthesis: biological functions and pathophysiology. Free Radic Res, 2000. 31(6): p. 577–96. - PubMed
    1. Andrews AM, et al., Direct, real-time measurement of shear stress-induced nitric oxide produced from endothelial cells in vitro. Nitric Oxide, 2010. 23(4): p. 335–42. - PMC - PubMed
    1. Andrews AM, et al., Shear stress-induced NO production is dependent on ATP autocrine signaling and capacitative calcium entry. Cell Mol Bioeng, 2014. 7(4): p. 510–520. - PMC - PubMed
    1. Dudzinski DM and Michel T, Life history of eNOS: Partners and pathways. Cardiovascular Research, 2007. 75(2): p. 247–260. - PMC - PubMed
    1. Fleming I, Molecular mechanisms underlying the activation of eNOS. Pflugers Arch, 2010. 459(6): p. 793–806. - PubMed

Publication types

MeSH terms

LinkOut - more resources