. 2021 Jul;27(7):1036.e1-1036.e8.
doi: 10.1016/j.cmi.2021.03.029. Epub 2021 Apr 2.

Recommendations for accurate genotyping of SARS-CoV-2 using amplicon-based sequencing of clinical samples

Affiliations

Recommendations for accurate genotyping of SARS-CoV-2 using amplicon-based sequencing of clinical samples

Slawomir Kubik et al. Clin Microbiol Infect. 2021 Jul.

Abstract

Objectives: Genotyping of severe acute respiratory syndrome coronavirus 2 (SARS-CoV-2) has been instrumental in monitoring viral evolution and transmission during the pandemic. The quality of the sequence data obtained from these genotyping efforts depends on several factors, including the quantity/integrity of the input material, the technology, and laboratory-specific implementation. The current lack of guidelines for SARS-CoV-2 genotyping leads to inclusion of error-containing genome sequences in genomic epidemiology studies. We aimed to establish clear and broadly applicable recommendations for reliable virus genotyping.

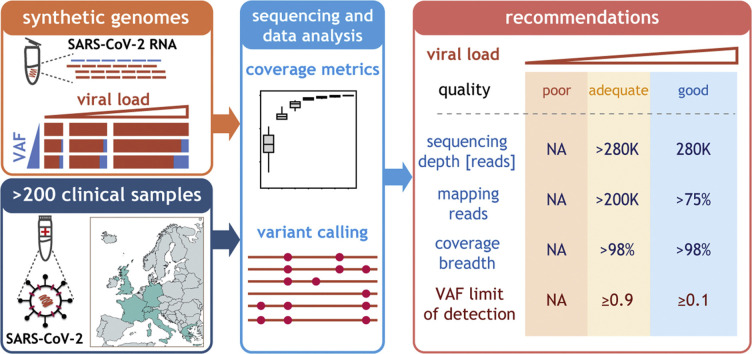
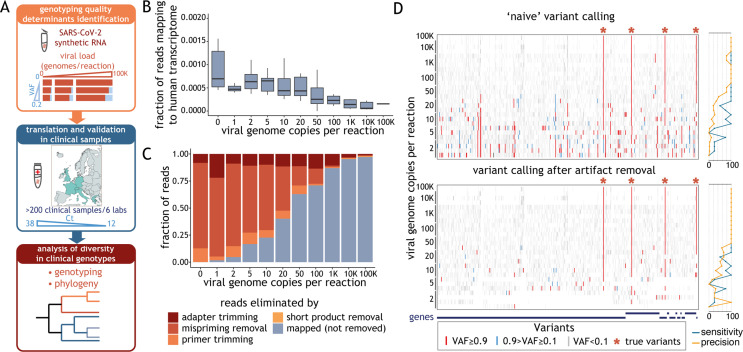
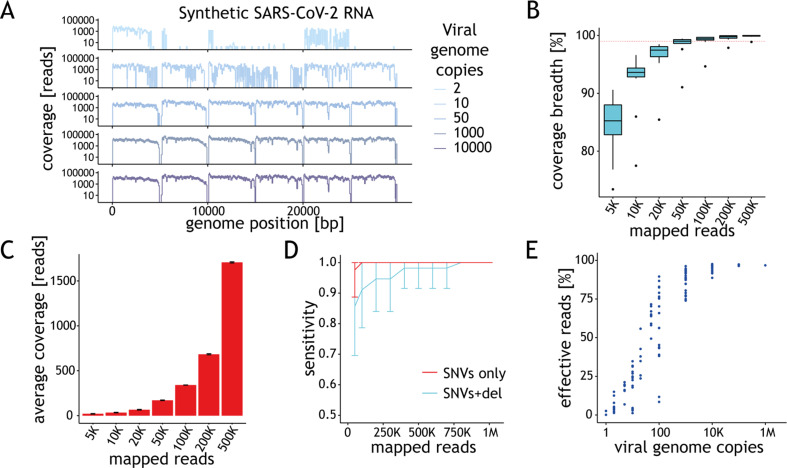
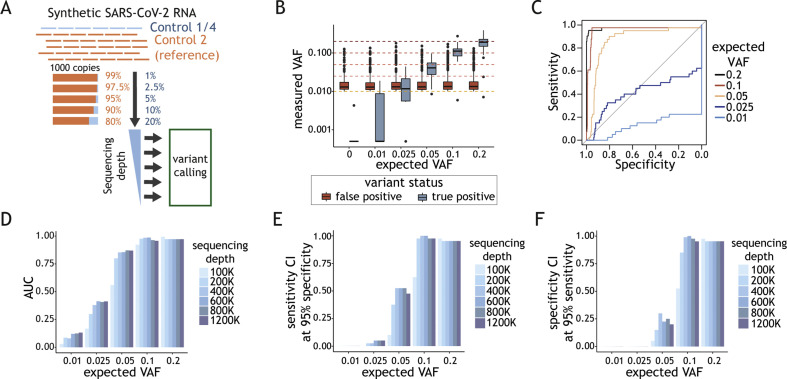
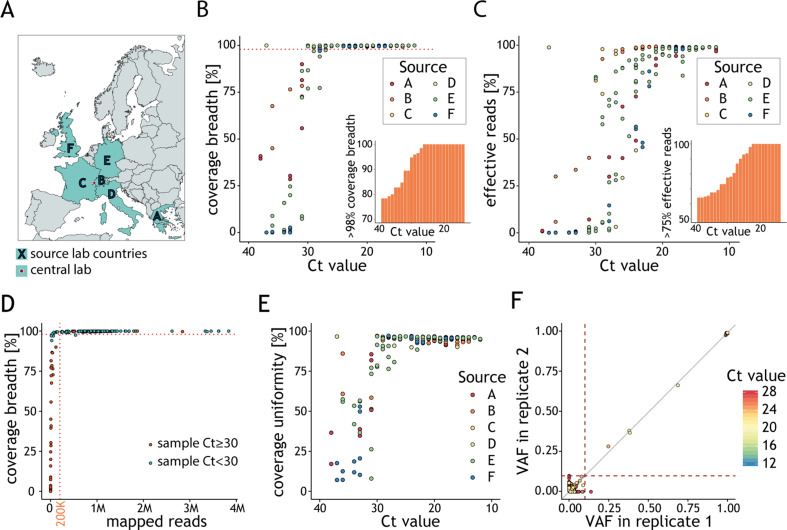
Methods: We established and used a sequencing data analysis workflow that reliably identifies and removes technical artefacts; such artefacts can result in miscalls when using alternative pipelines to process clinical samples and synthetic viral genomes with an amplicon-based genotyping approach. We evaluated the impact of experimental factors, including viral load and sequencing depth, on correct sequence determination.

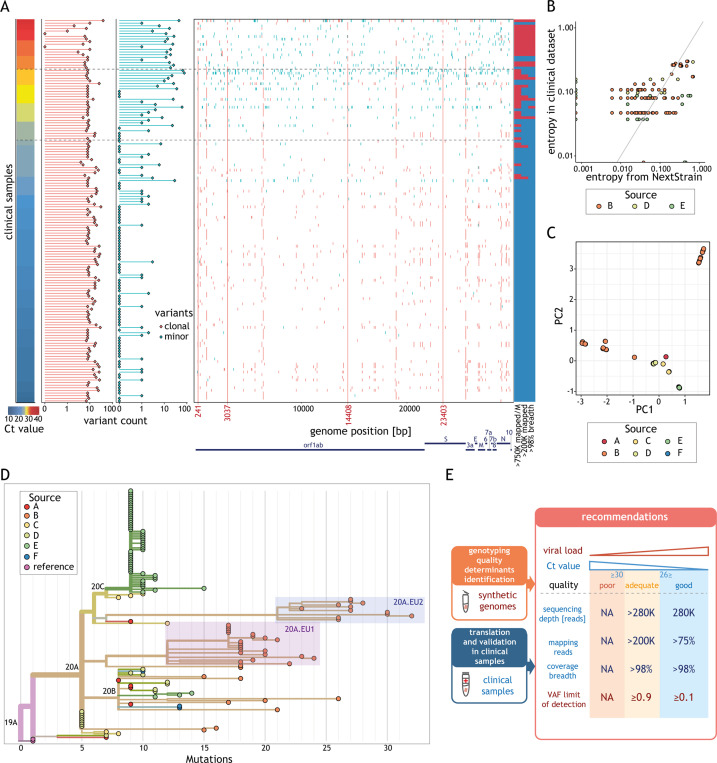
Results: We found that at least 1000 viral genomes are necessary to confidently detect variants in the SARS-CoV-2 genome at frequencies of ≥10%. The broad applicability of our recommendations was validated in over 200 clinical samples from six independent laboratories. The genotypes we determined for clinical isolates with sufficient quality cluster by sampling location and period. Our analysis also supports the rise in frequencies of 20A.EU1 and 20A.EU2, two recently reported European strains whose dissemination was facilitated by travel during the summer of 2020.

Conclusions: We present much-needed recommendations for the reliable determination of SARS-CoV-2 genome sequences and demonstrate their broad applicability in a large cohort of clinical samples.

Keywords: Amplicon; Coronavirus; Genome; Genotyping; Guidelines; NGS; Next-generation sequencing; Recommendations; SARS-CoV-2.


Figures

Image 1
Graphical abstract
Fig. 1
Fig. 1
Artefact removal is a prerequisite for reliable variant calling. (A) Schematic representation of the study. In experiments using synthetic severe acute respiratory syndrome coronavirus 2 (SARS-CoV-2) RNA, we varied a number of experimental parameters—including viral load, variant allele fraction (VAF) and sequencing depth—and determined which of these factors critically impact(s) genotyping quality (top box). We validated these metrics using data obtained from clinical samples, whose viral load is reflected by the cycle threshold (Ct) value (middle box). We determined the phylogeny of all clinical samples that met our guidelines (bottom box). (B) Distribution of the fraction of raw reads aligning to human transcriptome (y-axis), obtained with STAR aligner, as a function of the number of synthetic viral genome in the sample (x-axis). The horizontal line in the boxplot indicates the median and the whiskers the 5% and 95% quantile. (C) Average fraction (from at least three replicates) of sequencing reads that mapped to the SARS-CoV-2 genome or were the result of different technical artefacts (y-axis) for samples with varying amounts of synthetic viral genomes (x-axis). (D) Ideogram depicting the location of variants detected in samples with a varying number of synthetic viral genomes (denoted on the left) before (top panel) and after (bottom panel) removal of reads labelled as technical artefacts. Variants with allele fraction <0.1, between 0.1 and 0.9, and >0.9 are shown in grey, blue and red, respectively. Expected SARS-CoV-2 variants present in the control are marked with asterisks. Plots on the right show sensitivity and precision of the variant calls.
Fig. 2
Fig. 2
Performance of the assay depends on the amount of starting material. (A) Ideograms depicting the genome coverage (y-axis) for representative samples with varying amount of synthetic viral genomes (x-axis). Signal drops every 5 kb are expected due to gaps in the reference material. (B) Distribution of the genome coverage breadth (y-axis) as a function of the number of mapped reads for samples with 10 000 genome copies per reaction (g.c.p.r.). Horizontal dashed line depicts 98% coverage breadth. The horizontal line in the boxplot indicates the median and the whiskers the 5% and 95% quantiles. (C) Average coverage depth across synthetic severe acute respiratory syndrome coronavirus 2 (SARS-CoV-2) genome (y-axis) as a function of the number of mapped reads (x-axis) based on data from samples with 10 000 g.c.p.r. (D) Average sensitivity of variant calling for single nucleotide variants (SNVs) (red) or SNVs + 10 bp indel (cyan) in SARS-CoV-2-c1 (y-axis) as a function of the number of mapped reads based on the results obtained for samples with at least 98% genome coverage breadth. Error bars represent standard deviation. (E) Percentage of effective reads (y-axis) shown as a function of the viral load (g.c.p.r.) in the sample. Each point represents the data for one sample.
Fig. 3
Fig. 3
Determination of assay parameters for reliable intra-host variability detection. (A) Schematic representation of the experimental design. Varying amounts of SARS-CoV-2 (severe acute respiratory syndrome coronavirus 2) Control 1 or 4 (blue) were mixed with SARS-CoV-2 synthetic genome reference (Control 2) to obtain desired variant allele fractions (VAFs) (0.01–0.2). One thousand viral genome copy mixes (g.c.p.r.) were spiked into human RNA. Variant calling was performed at varying sequencing depths. (B) Distribution of variant fraction measured for known (true positives, blue) and background (false positives, red) variants (y-axis) as a function of the expected VAFs in the samples (x-axis). The black horizontal line in the boxplot indicates the median and the whiskers the 5% and 95% quantiles. (C) Sensitivity (y-axis) as a function of the specificity (x-axis) with VAF value used as a predictor for true variant calls. The ROC curves are colour-coded depending on the expected VAF of the known variants in each experiment. (D) Area under the ROC curve (AUC) (y-axis) as a function of the expected VAF of the variants (x-axis) at sequencing depth between 100K and 1200K reads. Colour code for analysis done with samples at different sequencing depth is depicted on the right. (E) Sensitivity CI (confidence interval) calculated at 95% specificity (y-axis) and (F) specificity CI at 95% sensitivity (y-axis) as a function the expected VAF for the variant (x-axis). Colour code for analysis done at different sequencing depths is depicted on the right.
Fig. 4
Fig. 4
Viral genotype assignment in clinical samples reflects global genome diversity. (A) The multicentre study involved six laboratories, located in different European countries, which generated datasets analysed at a central location (SOPHiA GENETICS, Switzerland). (B) Fraction of viral genome covered by at least ten reads (y-axis) as a function of the cycle threshold (Ct) value (y-axis). Each point represents the results for a sample, colour-coded according to the source lab. The dashed line indicates 98% coverage breadth. The percentage of samples with at least 98% genome coverage breadth (y-axis) below a given Ct (x-axis) is represented in the inset. (C) Fraction of effective reads mapping to the genome of severe acute respiratory syndrome coronavirus 2 (SARS-CoV-2) (y-axis) as a function of the Ct value of the clinical samples (x-axis). Each point represents the results for a sample colour-coded according to the source lab. The percentage of samples with at least 75% effective reads (y-axis) below a given Ct (x-axis) is represented in the inset. (D) Fraction of viral genome covered by at least ten reads (y-axis) as a function of the number of reads mapping to the SARS-CoV-2 genome (x-axis). Each point represents a sample and is colour-coded according to its Ct value. The horizontal dotted line indicates 98% coverage breadth and vertical dotted line indicates 200K mapped reads. (E) Percentage of genome coverage uniformity (y-axis) as a function of the sample Ct value (x-axis). Each point represents the results for a sample colour-coded according to the source lab. (F) Relationship between variant fraction for variant calls in clinical samples processed in replicates and with genome coverage breadth >98%. Dotted lines demarcate variant allele fraction (VAF) = 0.1. Variants are coloured based on the Ct value of the replicate.
Fig. 5
Fig. 5
Variant frequencies found in the clinical dataset reflect global frequencies. (A) Summary of the variant calling analysis for all unique clinical samples (rows) sorted by the cycle threshold (Ct) value (left). The horizontal dashed lines indicate Ct values of 26 and 30. The numbers of clonal (variant allele fractions, VAF ≥ 0.9, red) and minor (0.1 < VAF < 0.9, cyan) variants for each sample are represented as horizontal bar-plots (middle left). The position of each clonal (red) and minor (cyan) variant is displayed along the genome (middle right). Coordinates marked in red indicate positions of the most prevalent variants. Classification of the samples relative to the different recommendations (listed below each column) (right): blue indicates the recommendation was fulfilled and red that it was not. (B) Relationship between the entropy estimated for all clonal variants in clinical samples (y-axis) and the entropy of the same variants in samples collected in the same country and during the same period according to Nextstrain [30] (x-axis). Only samples with >200 K effective reads and 98% coverage breadth from centres with data for more than 15 samples were considered in this analysis. (C) 2-D principal component analysis results of clonal variants in clinical isolates (points). Points are coloured based on the sample source. (D) Phylogenetic tree of all clinical isolates with >200 K effective reads and 98% coverage breadth criteria. Samples are coloured according to the source. Clades (according to Nextstrain) are indicated. Samples corresponding to subclade 20A.EU.1 and 20A.EU.2 are highlighted by red and blue boxes, respectively. Length of the branches reflects the number of mutations (x-axis). The tree visualization was generated using the Nextstrain platform [30]. (E) Schematic representation of the recommendations for reliable genotyping with amplicon-based approach. We used synthetic viral genomes to determine the minimal viral load and VAF. We validated these recommendations and made them broadly applicable using clinical samples by determining the minimal sequencing depth, fraction of mapped reads and coverage breadth. Samples were classified into three quality categories based on their viral load: good (≥1000 genome copies per reaction (g.c.p.r.)), adequate (uncertain g.c.p.r., Ct values in the range 26–30) and poor (<100 g.c.p.r., typically value Ct > 30).

Similar articles

Cited by

References

    1. Coronaviridae Study Group of the International Committee on Taxonomy of Viruses The species Severe acute respiratory syndrome-related coronavirus: classifying 2019-nCoV and naming it SARS-CoV-2. Nat Microbiol. 2020;5:536–544. - PMC - PubMed
    1. Wu F., Zhao S., Yu B., Chen Y.-M., Wang W., Song Z.-G. A new coronavirus associated with human respiratory disease in China. Nature. 2020;579:265–269. - PMC - PubMed
    1. Zhou P., Yang X.-L., Wang X.-G., Hu B., Zhang L., Zhang W. A pneumonia outbreak associated with a new coronavirus of probable bat origin. Nature. 2020;579:270–273. - PMC - PubMed
    1. Meredith L.W., Hamilton W.L., Warne B., Houldcroft C.J., Hosmillo M., Jahun A.S. Rapid implementation of SARS-CoV-2 sequencing to investigate cases of health-care associated COVID-19: a prospective genomic surveillance study. Lancet Infect Dis. 2020;20:1263–1272. - PMC - PubMed
    1. Grubaugh N.D., Ladner J.T., Lemey P., Pybus O.G., Rambaut A., Holmes E.C. Tracking virus outbreaks in the twenty-first century. Nat Microbiol. 2019;4:10–19. - PMC - PubMed