Editorial
. 2021 May 1;320(5):E891-E897.
doi: 10.1152/ajpendo.00628.2020. Epub 2021 Apr 5.

Importance of the route of insulin delivery to its control of glucose metabolism

Affiliations
Editorial

Importance of the route of insulin delivery to its control of glucose metabolism

Dale S Edgerton et al. Am J Physiol Endocrinol Metab. .

Abstract

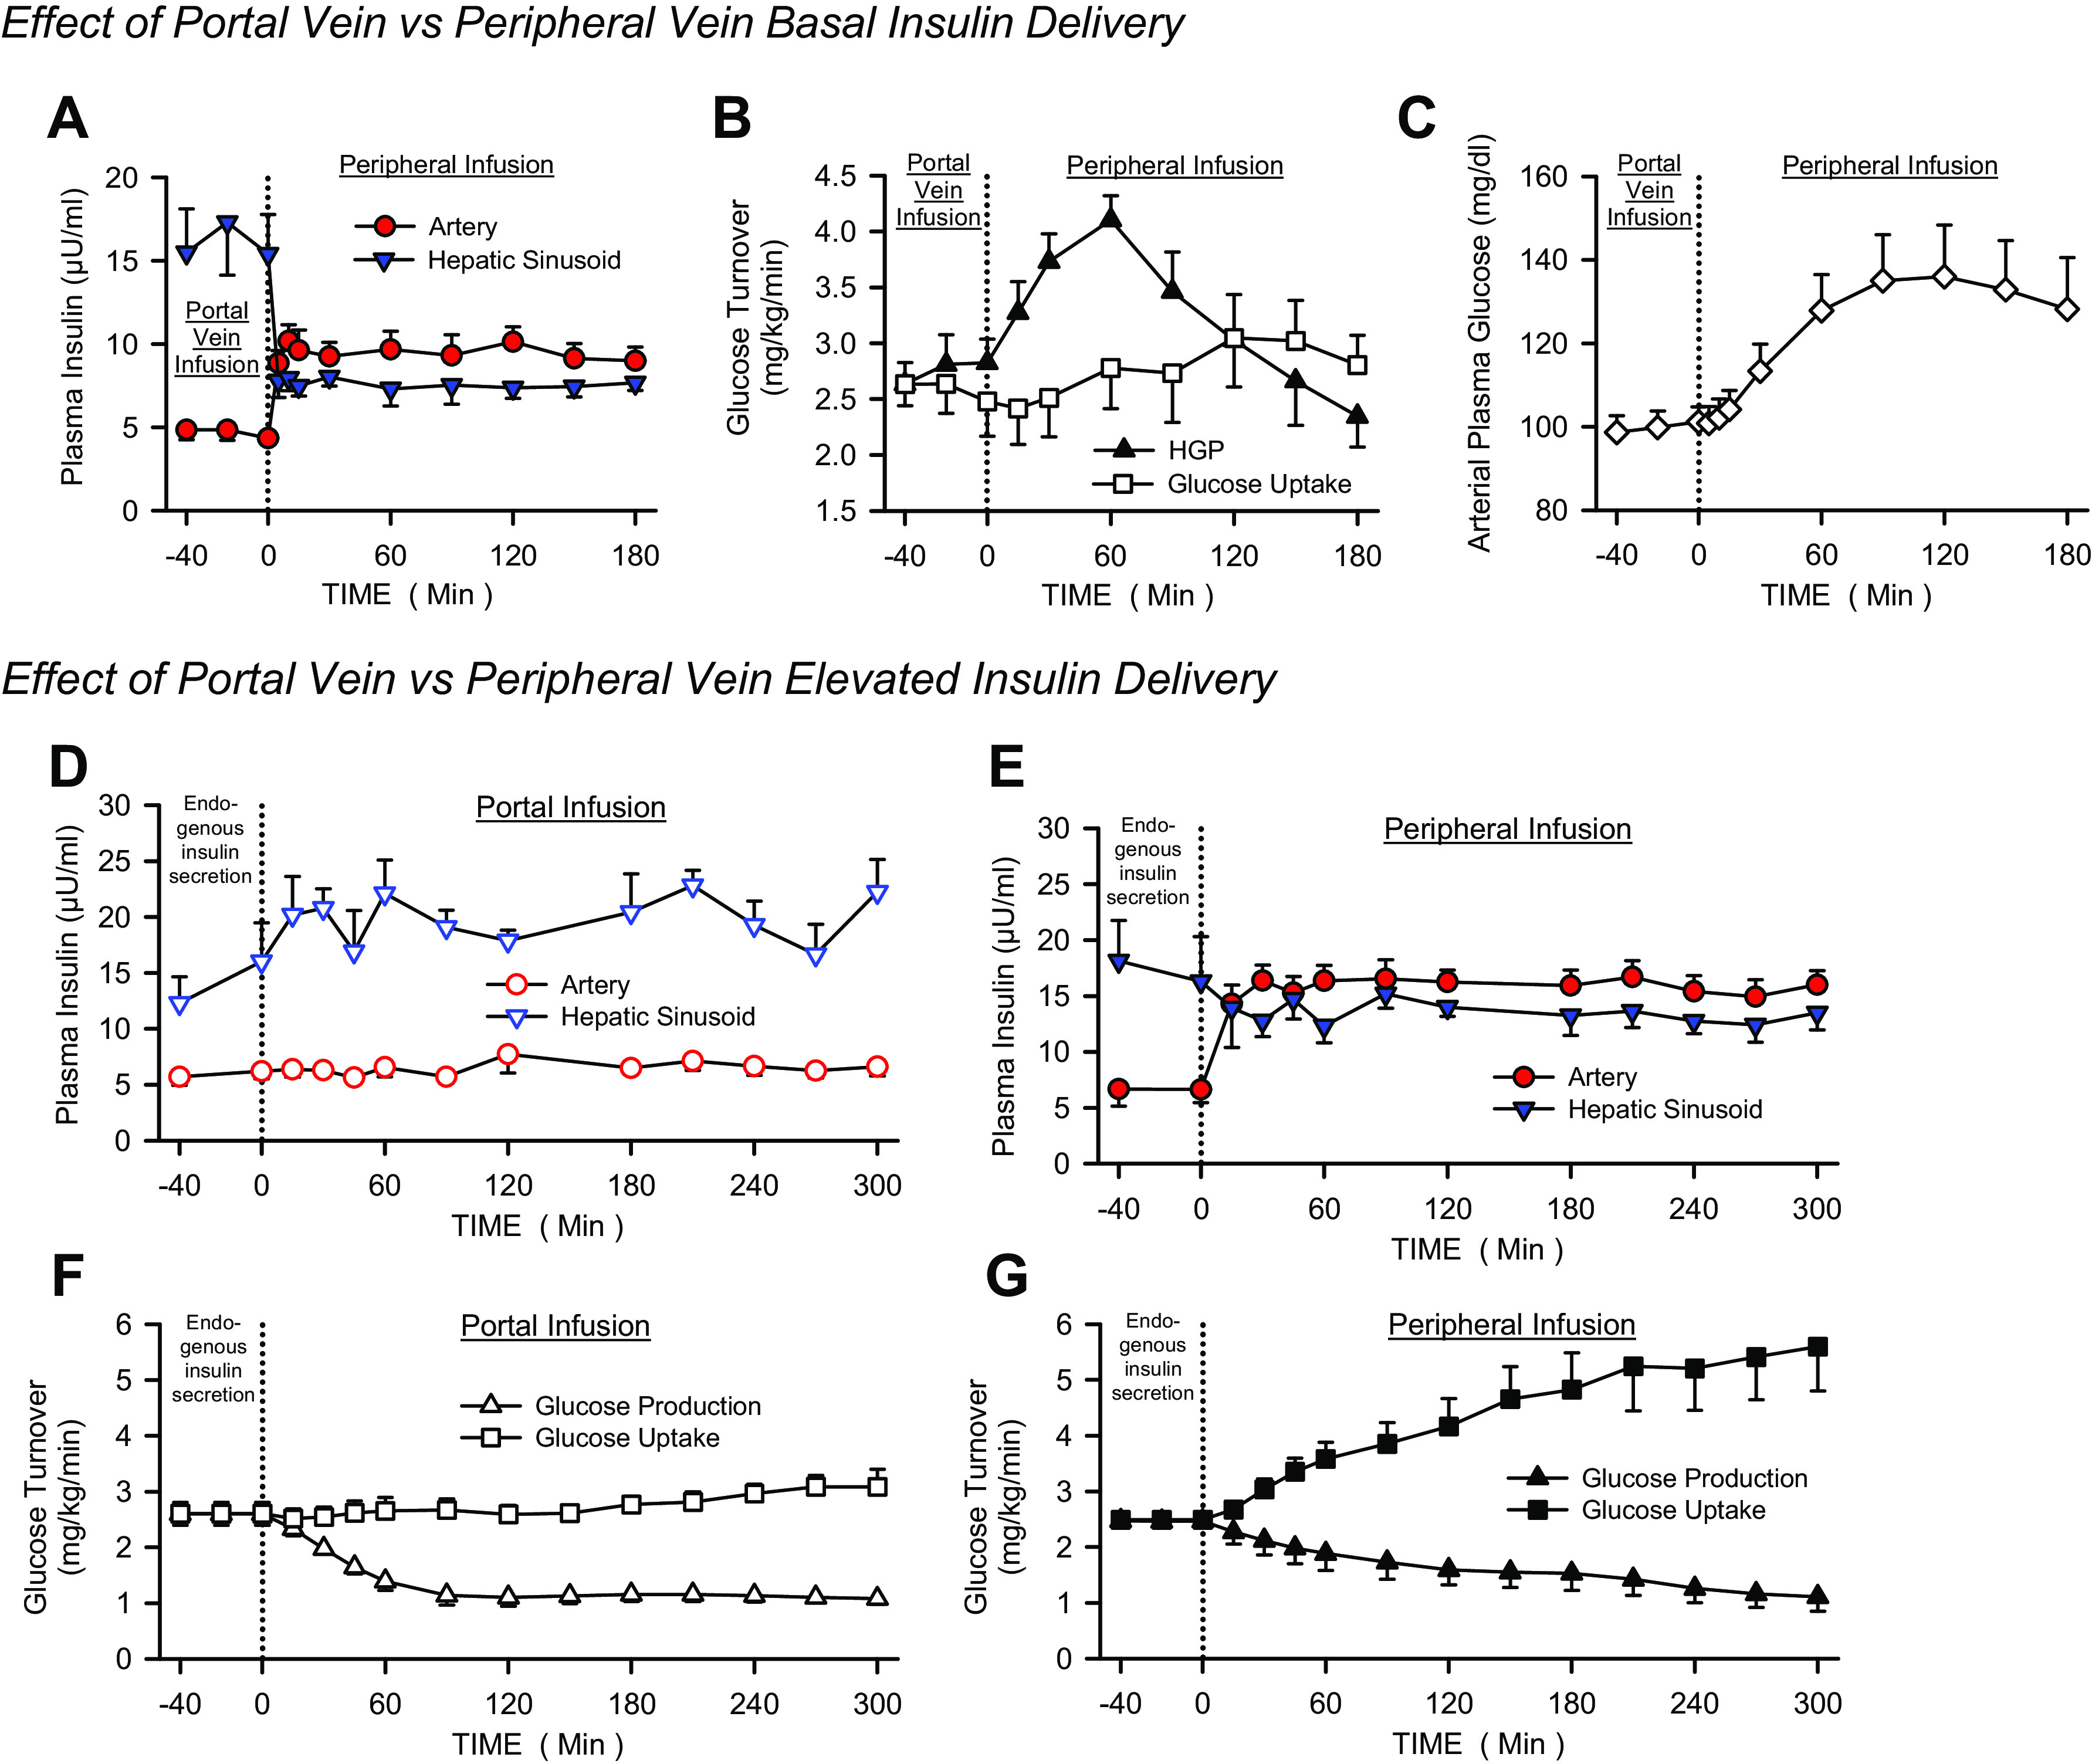
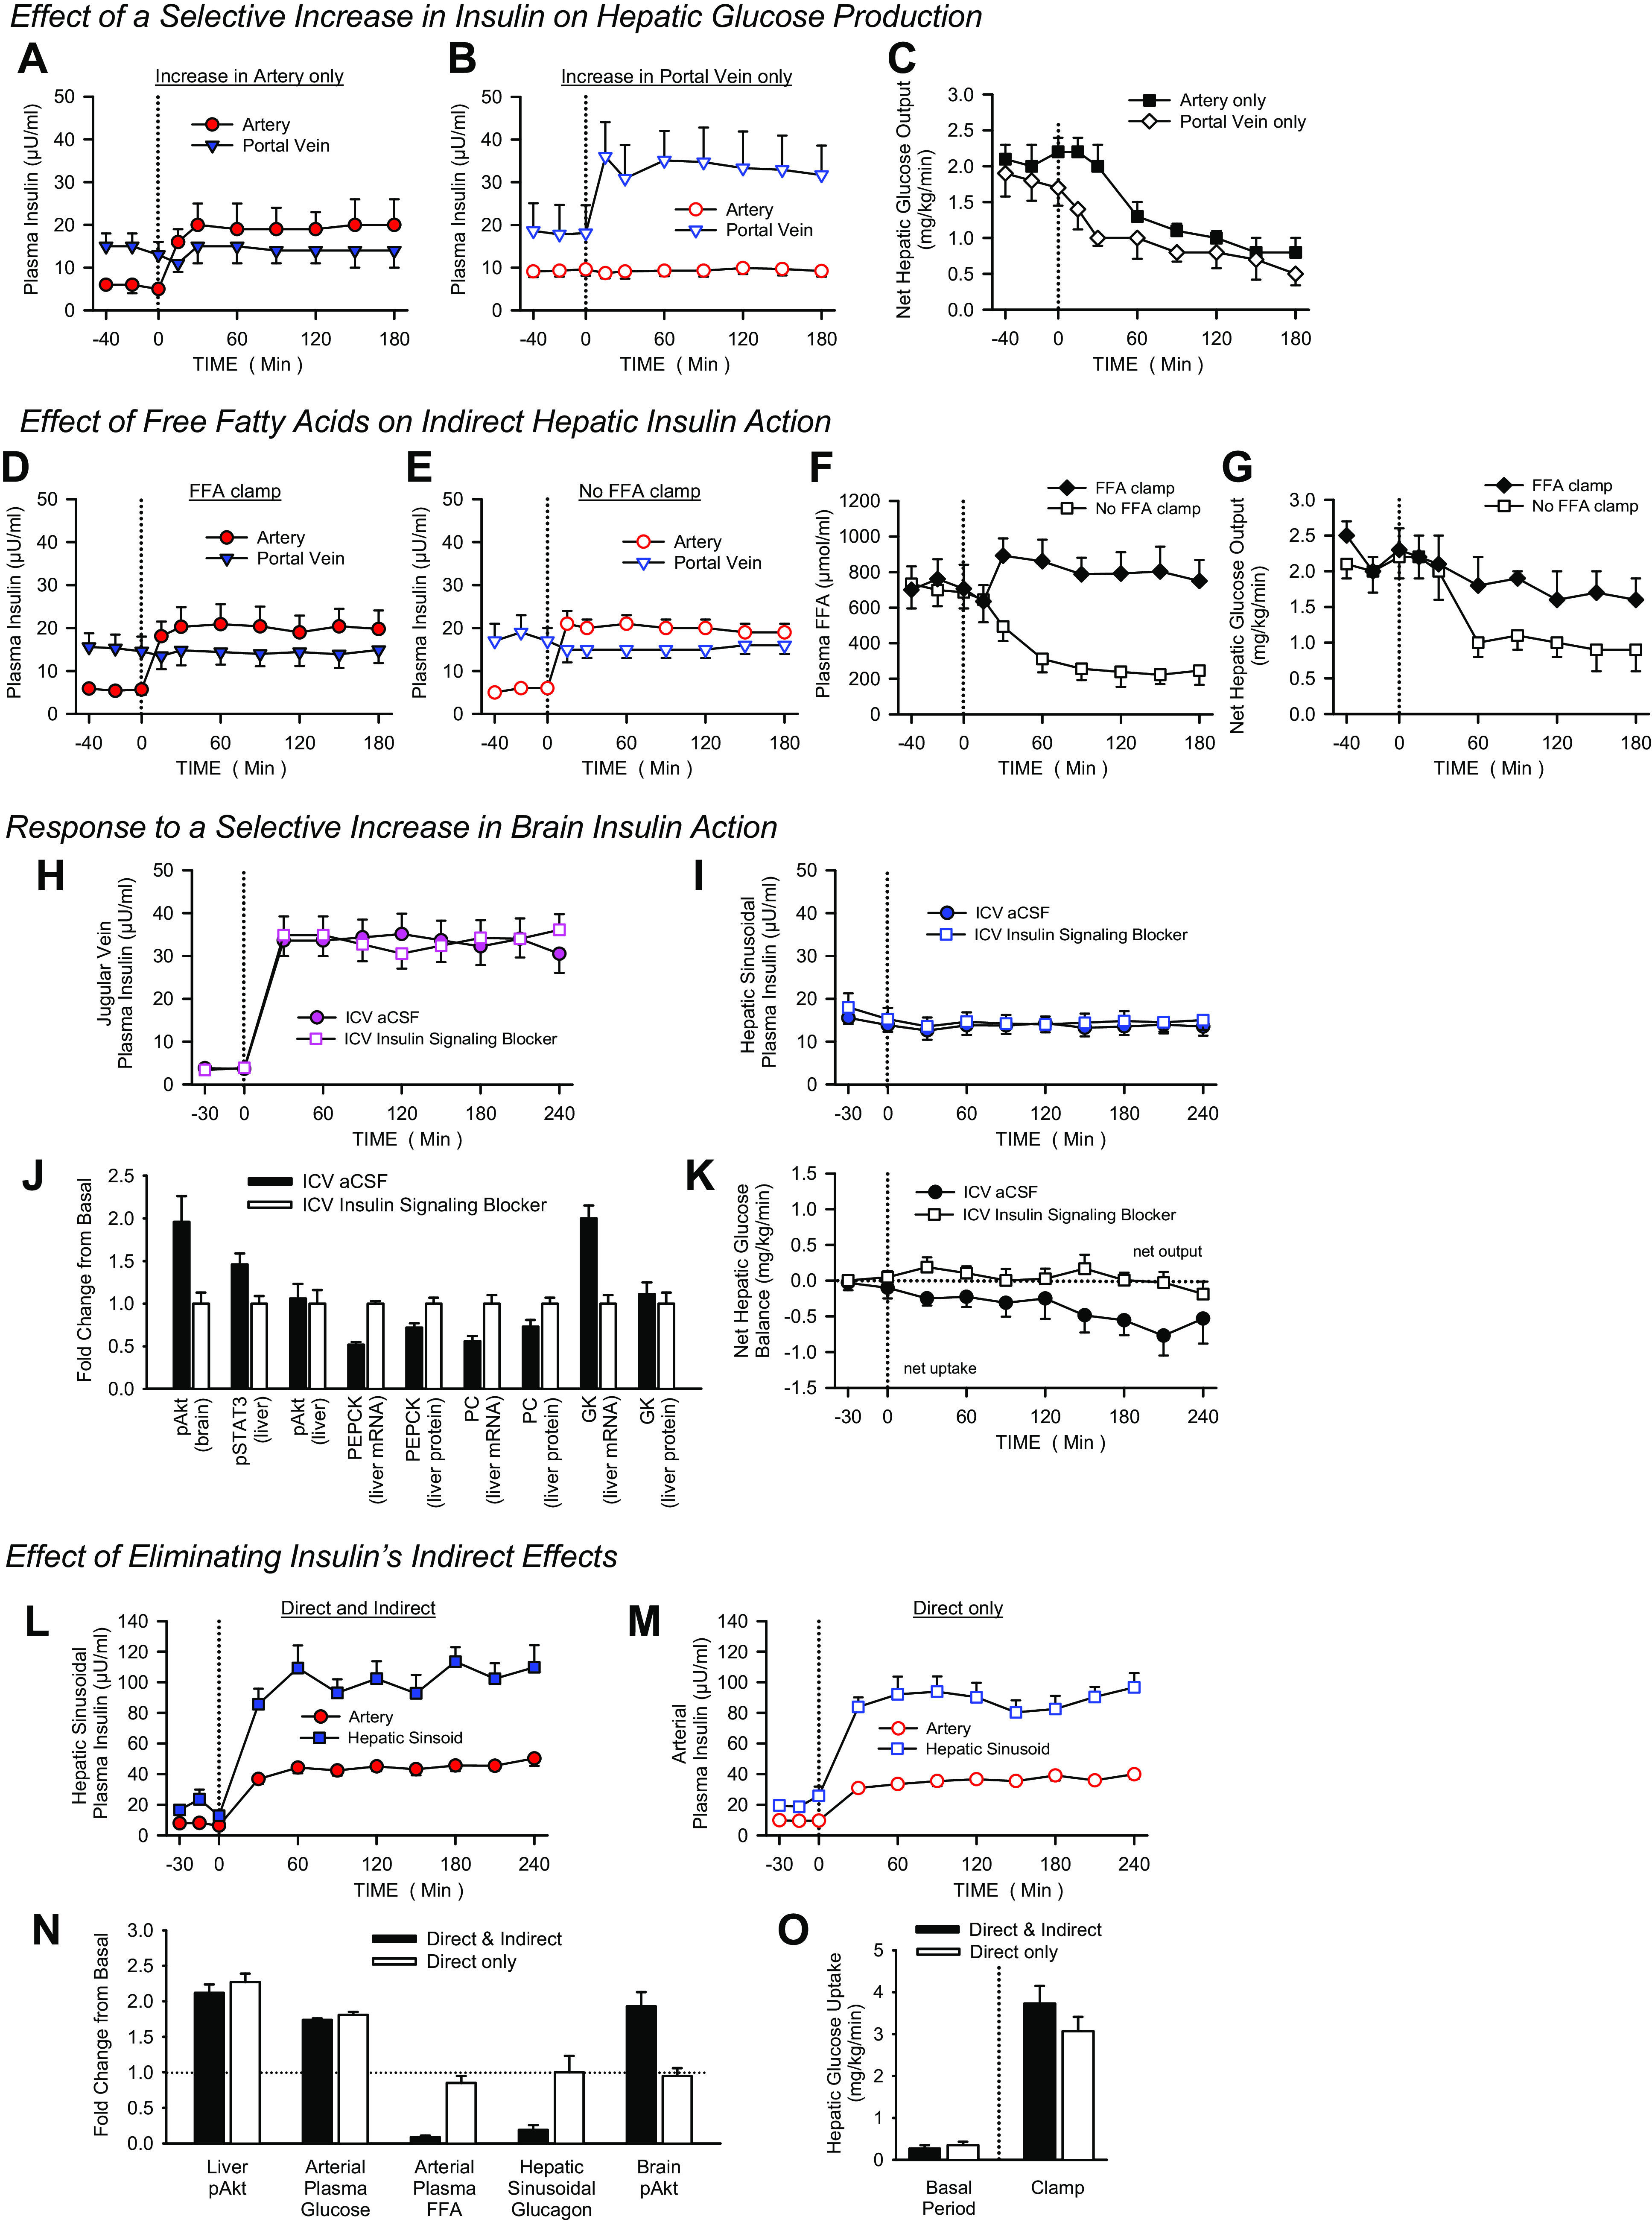
Pancreatic insulin secretion produces an insulin gradient at the liver compared with the rest of the body (approximately 3:1). This physiological distribution is lost when insulin is injected subcutaneously, causing impaired regulation of hepatic glucose production and whole body glucose uptake, as well as arterial hyperinsulinemia. Thus, the hepatoportal insulin gradient is essential to the normal control of glucose metabolism during both fasting and feeding. Insulin can regulate hepatic glucose production and uptake through multiple mechanisms, but its direct effects on the liver are dominant under physiological conditions. Given the complications associated with iatrogenic hyperinsulinemia in patients treated with insulin, insulin designed to preferentially target the liver may have therapeutic advantages.

Keywords: CNS insulin; free fatty acids; glucagon; hepatic glucose production; hepatic glucose uptake.


Conflict of interest statement

No conflict of interest for D. S. Edgerton, M. C. Moore, or G. Kraft. A. D. Cherrington has financial interests in Abvance, Biocon, Diakard/Diabetica, Fractyl, Novo Nordisk, and vTv Therapeutics.

Figures

Figure 1.
Figure 1.
AC adapted from the study by Edgerton et al. (19): arterial and hepatic sinusoidal insulin levels (A) during portal (−40 to 0 min) or peripheral vein (0 to 180 min) insulin infusion (basal rate: 200 µU/kg/min from −40 to 180 min). With portal insulin infusion during the basal period (−40 to 0 min), the normal 3 to 1 insulin gradient was present (A), and glucose turnover (B) was in steady state (i.e., rates of glucose appearance and disappearance were similar). After switching to peripheral insulin delivery (0 to 180 min), arterial insulin levels doubled, whereas hepatic levels fell by 50% (A). Consequently, hepatic glucose production (HGP) was rapidly stimulated (B), there was a slow and slight rise in whole body glucose uptake over time (B), and plasma glucose levels quickly increased (C). Published previously in Edgerton et al. (19) Insulin’s direct effects on the liver dominate the control of hepatic glucose production. J Clin Invest 116: 521–527, 2006. Copyright 2006 by American Society for Clinical Investigation. DG adapted from the study by Edgerton et al. (20): arterial and hepatic sinusoidal insulin levels (DE) during a basal period (−40 to 0 min; endogenous insulin secretion), and during a euglycemic clamp (0 to 300 min) when insulin was infused (300 µU/kg/min) into either the portal vein (D) or a peripheral vein (E). With portal infusion, HGP was rapidly suppressed, whereas whole body glucose uptake was minimally affected (F). With peripheral delivery, HGP was suppressed more slowly and glucose uptake was greatly amplified (G). Published previously in Edgerton et al. (20) Changes in glucose and fat metabolism in response to the administration of a hepato-preferential insulin analog. Diabetes 63: 3946–3954, 2014. Copyright 2014 by the American Diabetes Association. Data are expressed as means ± SE. P < 0.05 vs. baseline for A: artery and hepatic sinusoid (5–180 min); B: HGP (15–30 min); C: glucose (60–180 min); E: artery (15–300 min); F: HGP (15–300 min) and glucose uptake (240–300 min); G: HGP (90–300 min) and glucose uptake (150–300 min).
Figure 2.
Figure 2.
AC adapted from the study by Sindelar et al. (22): following a basal period (−40 to 0 min), plasma insulin levels were selectively elevated, either only at the artery (A) or at the hepatic portal vein (B). Both indirect (artery only) and direct (portal vein only) insulin action suppressed net hepatic glucose output (C), although insulin’s direct hepatic effect was more rapid. Published previously in Sindelar et al. (22) A comparison of the effects of selective increases in peripheral or portal insulin on hepatic glucose production in the conscious dog. Diabetes 45: 1594–1604, 1996. Copyright 1996 by the American Diabetes Association. DG adapted from the study by Sindelar et al. (23): following a basal period (−40 to 0 min), arterial insulin levels were selectively increased while insulin at the liver was maintained at basal (D and E; 0 to 180 min). In one group, triglycerides plus heparin were infused to clamp arterial plasma free fatty acids (FFA) at basal, whereas in another the FFA levels were allowed to fall (F). Preventing the suppression of FFA eliminated much of insulin’s indirect effect on net hepatic glucose output (G). Published previously in Sindelar et al. (23) The role of fatty acids in mediating the effects of peripheral insulin on hepatic glucose production in the conscious dog. Diabetes 46: 187–196, 1997. Copyright 1997 by the American Diabetes Association. HK adapted from the study by Ramnanan et al. (31): following a basal period (−30 to 0 min), infusion of insulin into the carotid and vertebral arteries increased insulin at the head 10-fold (H; 0 to 240 min), whereas insulin at the liver remained at basal (I). Brain insulin action activated the central nervous system (CNS)-liver insulin axis (J), increasing the phosphorylation of hypothalamic protein kinase B (p/Akt) and downstream, at the liver, phosphorylation of liver signal transducer and activator of transcription 3 (pSTAT3), without affecting hepatic pAkt. Hepatic gluconeogenic gene expression (phosphoenolpyruvate carboxykinase, PEPCK; and pyruvate carboxylase, PC) was suppressed, whereas glucokinase (GK) expression increased, due to insulin’s CNS effect. Changes in liver protein levels were more modest or did not occur. Intraventricular (ICV) infusion of a phosphatidylinositol 3-kinase (PI3K) inhibitor (LY294002) to block the activation of hypothalamic insulin signaling eliminated these effects (J). Analysis was performed on tissues collected at 240 min. Increased CNS insulin action was associated with a modest and delayed suppression of net hepatic glucose balance (K). Published previously in Ramnanan et al. (31) Brain insulin action augments hepatic glycogen synthesis without suppressing glucose production or gluconeogenesis in dogs. J Clin Invest 121: 3713–3723, 2011. Copyright 2011 by American Society for Clinical Investigation. LO adapted from the study by Kraft et al. (34): following a basal period (−30 to 0 min), glucose was infused to double the blood sugar whereas insulin was delivered intraportally (6-fold basal) (LM) to simulate postprandial-like conditions (0 to 240 min). In one group (Direct & Indirect), all of insulin’s effects were active, whereas in the other, only its direct effect was present (Direct only). In the latter, triglyceride was infused intravenously, glucagon intraportally, and an insulin receptor antagonist (S961) and K inhibitor (LY294002) were delivered into the third ventricle to prevent insulin induced suppression of plasma FFA and glucagon levels, and activation of brain insulin signaling (N). Analysis was performed on tissues collected at 240 min. Elimination of insulin’s indirect effects had no impact on the stimulation of HGU (O). Published previously in Kraft et al. (34) The importance of the mechanisms by which insulin regulates meal-associated liver glucose uptake in the dog. Diabetes. In press. 2021, Copyright 2021 by the American Diabetes Association. Data are expressed as means ± SE. P < 0.05 vs. baseline for A: artery (15–180 min); B: portal vein (15–180 min); C: selective increase in arterial insulin (60–180 min) and selective increase in portal vein insulin (15–180 min); D: artery (15–180 min); E: artery (15–180 min); F: no FFA clamp (60–180 min); G: no FFA clamp (60–180 min) and FFA clamp (120-180 min); H: both groups (30–240 min); and K: artificial cerebrospinal fluid (aCSF) (180–240 min). P < 0.05 between groups for J: hypothalamic pAkt, liver pSTAT3, PEPCK, PC and GK mRNA, and PEPCK and PC protein; N: plasma FFA and glucagon and hypothalamic pAkt.

Similar articles

Cited by

References

    1. Aronoff SL, Berkowitz K, Shreiner B, Want L. Glucose metabolism and regulation: beyond insulin and glucagon. Diabetes Spectrum 17: 183–190, 2004. doi:10.2337/DIASPECT.17.3.183. - DOI
    1. Gregory JM, Cherrington AD, Moore DJ. The peripheral peril: injected insulin induces insulin insensitivity in type 1 diabetes. Diabetes 69: 837–847, 2020. doi:10.2337/dbi19-0026. - DOI - PMC - PubMed
    1. Matteucci E, Giampietro O, Covolan V, Giustarini D, Fanti P, Rossi R. Insulin administration: present strategies and future directions for a noninvasive (possibly more physiological) delivery. Drug Des Devel Ther 9: 3109–3118, 2015. doi:10.2147/DDDT.S79322. - DOI - PMC - PubMed
    1. Capaldo B, Gastaldelli A, Antoniello S, Auletta M, Pardo F, Ciociaro D, Guida R, Ferrannini E, Sacca L. Splanchnic and leg substrate exchange after ingestion of a natural mixed meal in humans. Diabetes 48: 958–966, 1999. doi:10.2337/diabetes.48.5.958. - DOI - PubMed
    1. Ferrannini E, Wahren J, Felig P, DeFronzo RA. The role of fractional glucose extraction in the regulation of splanchnic glucose metabolism in normal and diabetic man. Metabolism 29: 28–35, 1980. doi:10.1016/0026-0495(80)90094-3. - DOI - PubMed

Publication types

MeSH terms

LinkOut - more resources