. 2021 May 24;376(1825):20200153.
doi: 10.1098/rstb.2020.0153. Epub 2021 Apr 5.

Single individual structural variant detection uncovers widespread hemizygosity in molluscs

Affiliations

Single individual structural variant detection uncovers widespread hemizygosity in molluscs

Andrew D Calcino et al. Philos Trans R Soc Lond B Biol Sci. .

Abstract

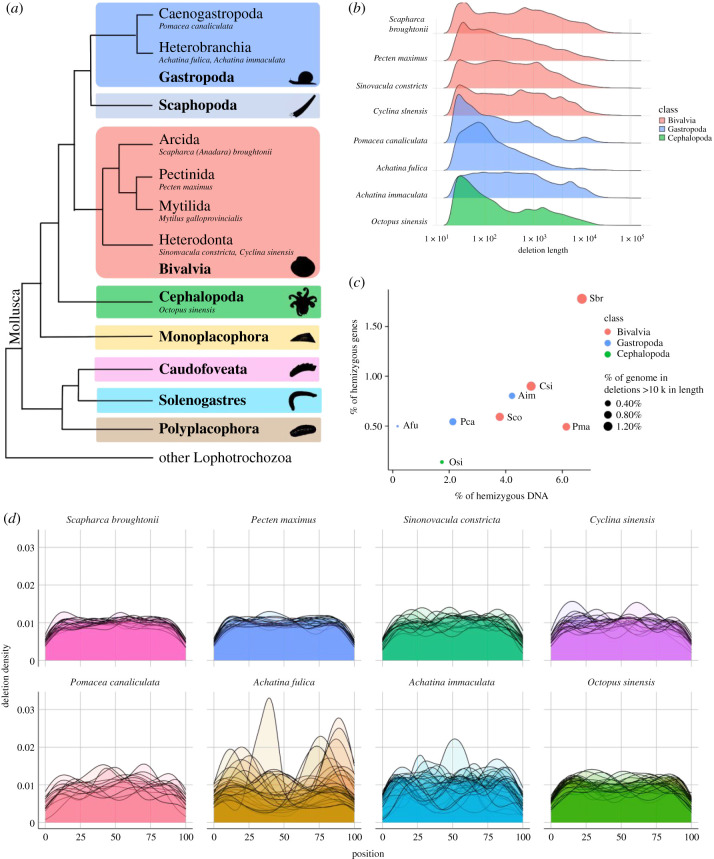
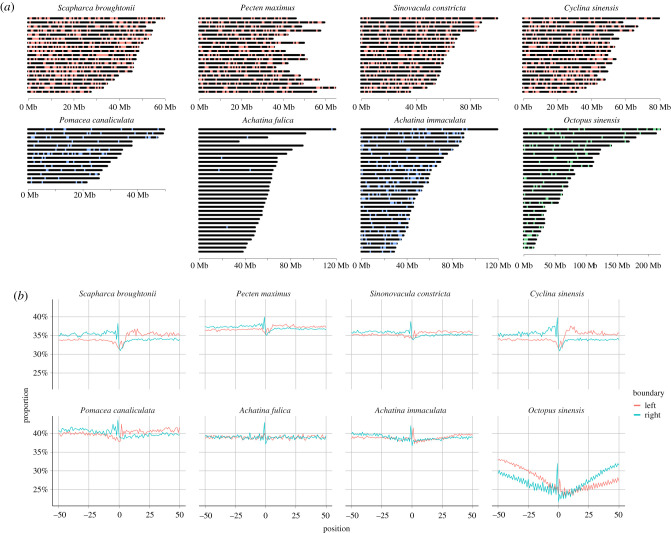
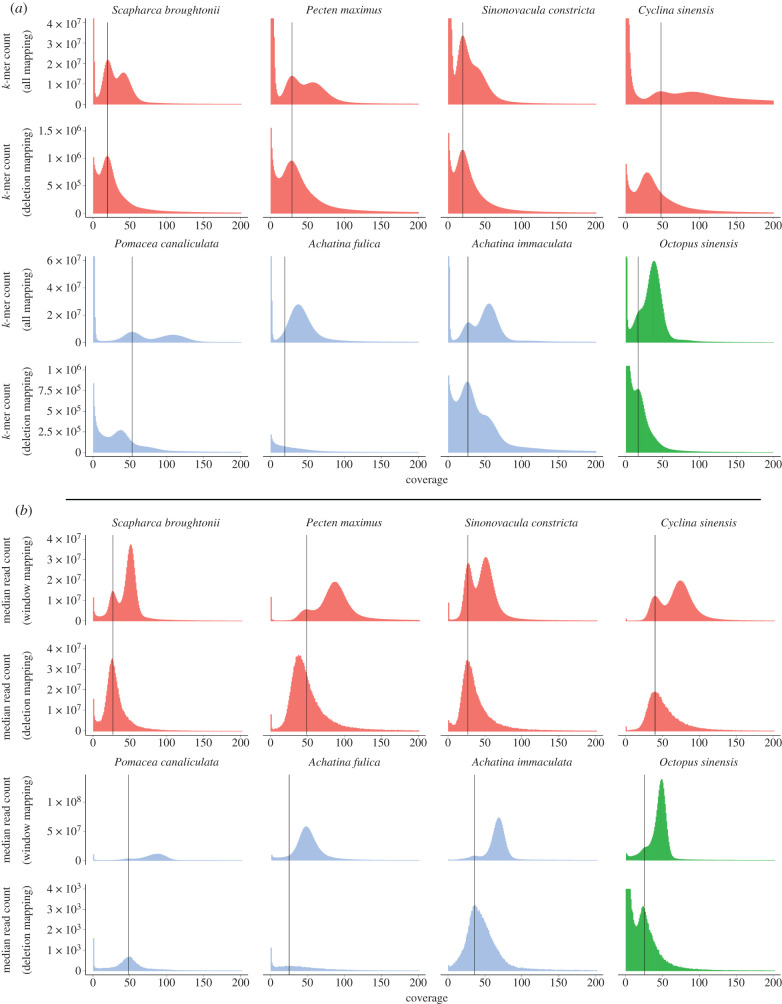
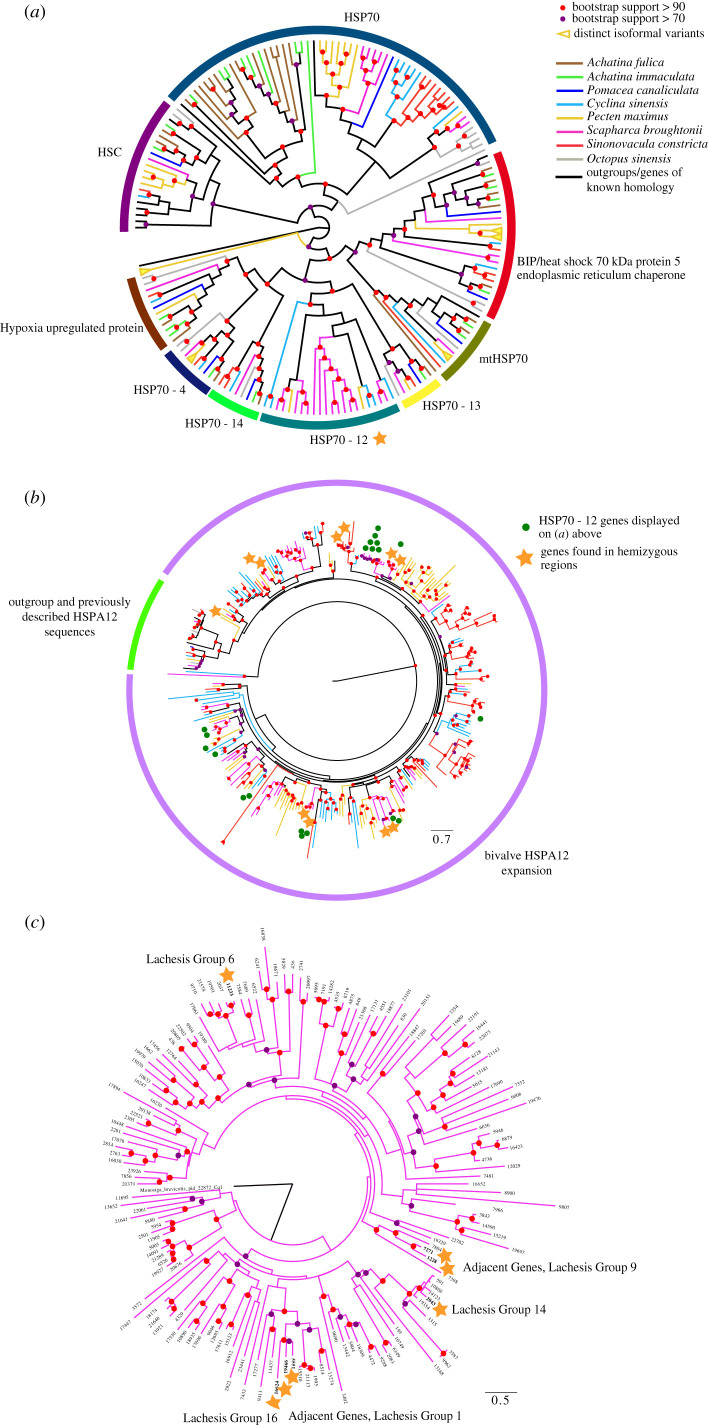
The advent of complete genomic sequencing has opened a window into genomic phenomena obscured by fragmented assemblies. A good example of these is the existence of hemizygous regions of autosomal chromosomes, which can result in marked differences in gene content between individuals within species. While these hemizygous regions, and presence/absence variation of genes that can result, are well known in plants, firm evidence has only recently emerged for their existence in metazoans. Here, we use recently published, complete genomes from wild-caught molluscs to investigate the prevalence of hemizygosity across a well-known and ecologically important clade. We show that hemizygous regions are widespread in mollusc genomes, not clustered in individual chromosomes, and often contain genes linked to transposition, DNA repair and stress response. With targeted investigations of HSP70-12 and C1qDC, we also show how individual gene families are distributed within pan-genomes. This work suggests that extensive pan-genomes are widespread across the conchiferan Mollusca, and represent useful tools for genomic evolution, allowing the maintenance of additional genetic diversity within the population. As genomic sequencing and re-sequencing becomes more routine, the prevalence of hemizygosity, and its impact on selection and adaptation, are key targets for research across the tree of life. This article is part of the Theo Murphy meeting issue 'Molluscan genomics: broad insights and future directions for a neglected phylum'.

Keywords: genome; hemizygosity; mollusc; pan-genome; presence/absence variation; structural variation.


Figures

Figure 1.
Figure 1.
Phylogeny and hemizygous loci analyses of eight molluscan species. (a) Representative cladogram of mollusc relationships after Kocot et al. [23]. Species referenced in this manuscript are shown in italics. Note, in Bivalvia and Gastropoda, numerous subclades are not shown. (b) Length distribution of hemizygous regions (deletions, log10 on both axes). (c) Percentage of each genome which is hemizygous versus the percentage of all genes which reside entirely within hemizygous DNA. The size of each point is proportional to the percentage of the genome found in large (greater than 10 kb) hemizygous regions. Species include Achatina fulica (Afu), Achatina immaculata (Aim), Cyclina sinensis (Csi), Octopus sinensis (Osi), Pecten maximus (Pma), Pomacea canaliculata (Pca), Scapharca broughtonii (Sbr) and Sinonovacula constricta (Sco). (d) Density of hemizygous loci for each species. Each chromosome is represented by an individual data series (line) which spans the beginning (0% distance) to the end (100% distance) of each chromosome. (Online version in colour.)
Figure 2.
Figure 2.
Chromosomal maps of hemizygous loci and G/C content across homozygous/hemizygous boundaries. (a) Hemizygous loci greater than 10 kb in length which were not flagged by pbsv as ‘tandem repeats’. Each locus is marked as a single point which is not proportional in length to the actual size of the locus. Genomes with red loci are bivalves, those with blue loci are gastropods and the genome with green loci is a cephalopod. (b) Average G/C content spanning 50 bp downstream and 50 bp upstream of the left homozygous/hemizygous boundary or 50 bp downstream and 50 bp upstream of the right homozygous/hemizygous boundary for all annotated hemizygous loci. In each species the transition between homozygous and hemizygous DNA is marked by a G/C spike and apart from the octopus, hemizygous DNA is generally more G/C rich than the flanking homozygous regions. For octopus, hemizygous loci are more A/T rich than the flanking homozygous regions and the entire region surrounding the boundary is relatively depleted of G/C nucleotides. (Online version in colour.)
Figure 3.
Figure 3.
k-mer and median read coverage analysis of hemizygous regions. (a) k-mer counts of all mapped reads for each genome with the corresponding k-mer counts of reads that map entirely within hemizygous regions located directly below. (b) Median read coverage of all 1000 bp sliding windows for each genome with the corresponding median read coverage of all annotated hemizygous regions located directly below. For both (a) and (b) the black vertical lines mark the ‘heterozygous’ peaks of the total mapped reads k-mer or median read coverage plots. Species are colour coded by class with red for bivalves, blue for gastropods and green for the cephalopod.
Figure 4.
Figure 4.
Phylogenies and cladograms of HSP70 and C1qDC superfamilies, showing the potential of hemizygous regions as a reservoir and driver of gene diversity. (a) Diagrammatic cladogram of HSP70 superfamily genes from the eight species examined here, with branches coloured according to species identity as seen in the key, and rooted with Arabidopsis thaliana HSP70 sequence. Arcs surrounding the cladogram indicate gene families. Phylogeny upon which this cladogram is based, inferred using the LG + R6 model, along with raw sequences, alignment and tree file, are available in electronic supplementary material, file S5. Note: this cladogram is not exhaustive and excludes some HSP70-related gene sequences due to alignment and trimming. (b) HSP70-12 phylogeny genes from the eight species examined here, along with outgroups and genes of known identity. Phylogeny inferred using the LG + F+R8 model. Note genes from hemizygous regions, indicated with a star. Genes also included in (a) indicated with a green dot. Phylogeny rooted with Arabidopsis thaliana HSP70 sequence. (c) C1qDC superfamily gene interrelationships in Scapharca broughtonii, displayed in a phylogeny reconstructed using the WAG + F + R6 model. Note genes from hemizygous regions, indicated with a star. The linkage groups for these genes, as assigned by Lachesis, are also noted alongside them.

Similar articles

  • Mobilizing molluscan models and genomes in biology.
    Davison A, Neiman M. Davison A, et al. Philos Trans R Soc Lond B Biol Sci. 2021 May 24;376(1825):20200163. doi: 10.1098/rstb.2020.0163. Epub 2021 Apr 5. Philos Trans R Soc Lond B Biol Sci. 2021. PMID: 33813892 Free PMC article.
  • Molluscan phylogenomics requires strategically selected genomes.
    Sigwart JD, Lindberg DR, Chen C, Sun J. Sigwart JD, et al. Philos Trans R Soc Lond B Biol Sci. 2021 May 24;376(1825):20200161. doi: 10.1098/rstb.2020.0161. Epub 2021 Apr 5. Philos Trans R Soc Lond B Biol Sci. 2021. PMID: 33813889 Free PMC article.
  • Molluscan mitochondrial genomes break the rules.
    Ghiselli F, Gomes-Dos-Santos A, Adema CM, Lopes-Lima M, Sharbrough J, Boore JL. Ghiselli F, et al. Philos Trans R Soc Lond B Biol Sci. 2021 May 24;376(1825):20200159. doi: 10.1098/rstb.2020.0159. Epub 2021 Apr 5. Philos Trans R Soc Lond B Biol Sci. 2021. PMID: 33813887 Free PMC article. Review.
  • MolluscDB: a genome and transcriptome database for molluscs.
    Caurcel C, Laetsch DR, Challis R, Kumar S, Gharbi K, Blaxter M. Caurcel C, et al. Philos Trans R Soc Lond B Biol Sci. 2021 May 24;376(1825):20200157. doi: 10.1098/rstb.2020.0157. Epub 2021 Apr 5. Philos Trans R Soc Lond B Biol Sci. 2021. PMID: 33813885 Free PMC article.
  • Potential of genomic technologies to improve disease resistance in molluscan aquaculture.
    Potts RWA, Gutierrez AP, Penaloza CS, Regan T, Bean TP, Houston RD. Potts RWA, et al. Philos Trans R Soc Lond B Biol Sci. 2021 May 24;376(1825):20200168. doi: 10.1098/rstb.2020.0168. Epub 2021 Apr 5. Philos Trans R Soc Lond B Biol Sci. 2021. PMID: 33813884 Free PMC article. Review.

Cited by

References

    1. Han MV, Thomas GWC, Lugo-Martinez J, Hahn MW. 2013. Estimating gene gain and loss rates in the presence of error in genome assembly and annotation using CAFE 3. Mol. Biol. Evol. 30, 1987-1997. (10.1093/molbev/mst100) - DOI - PubMed
    1. Moyers BA, Zhang J. 2016. Evaluating phylostratigraphic evidence for widespread de novo gene birth in genome evolution. Mol. Biol. Evol. 33, 1245-1256. (10.1093/molbev/msw008) - DOI - PMC - PubMed
    1. Read BA, et al. 2013. Pan genome of the phytoplankton Emiliania underpins its global distribution. Nature 499, 209-213. (10.1038/nature12221) - DOI - PubMed
    1. McCarthy CGP, Fitzpatrick DA. 2019. Pan-genome analyses of model fungal species. Microb. Genom. 5, e000243. (10.1099/mgen.0.000243) - DOI - PMC - PubMed
    1. Tettelin H, et al. 2005. Genome analysis of multiple pathogenic isolates of Streptococcus agalactiae: implications for the microbial ‘pan-genome’. Proc. Natl Acad. Sci. USA 102, 13 950-13 955. (10.1073/pnas.0506758102) - DOI - PMC - PubMed

Publication types

LinkOut - more resources