. 2021;11(3):1141-1155.
doi: 10.3233/JPD-202476.

Lipidomics Prediction of Parkinson's Disease Severity: A Machine-Learning Analysis

Affiliations

Lipidomics Prediction of Parkinson's Disease Severity: A Machine-Learning Analysis

Hila Avisar et al. J Parkinsons Dis. 2021.

Abstract

Background: The role of the lipidome as a biomarker for Parkinson's disease (PD) is a relatively new field that currently only focuses on PD diagnosis.

Objective: To identify a relevant lipidome signature for PD severity markers.

Methods: Disease severity of 149 PD patients was assessed by the Unified Parkinson's Disease Rating Scale (UPDRS) and the Montreal Cognitive Assessment (MoCA). The lipid composition of whole blood samples was analyzed, consisting of 517 lipid species from 37 classes; these included all major classes of glycerophospholipids, sphingolipids, glycerolipids, and sterols. To handle the high number of lipids, the selection of lipid species and classes was consolidated via analysis of interrelations between lipidomics and disease severity prediction using the random forest machine-learning algorithm aided by conventional statistical methods.

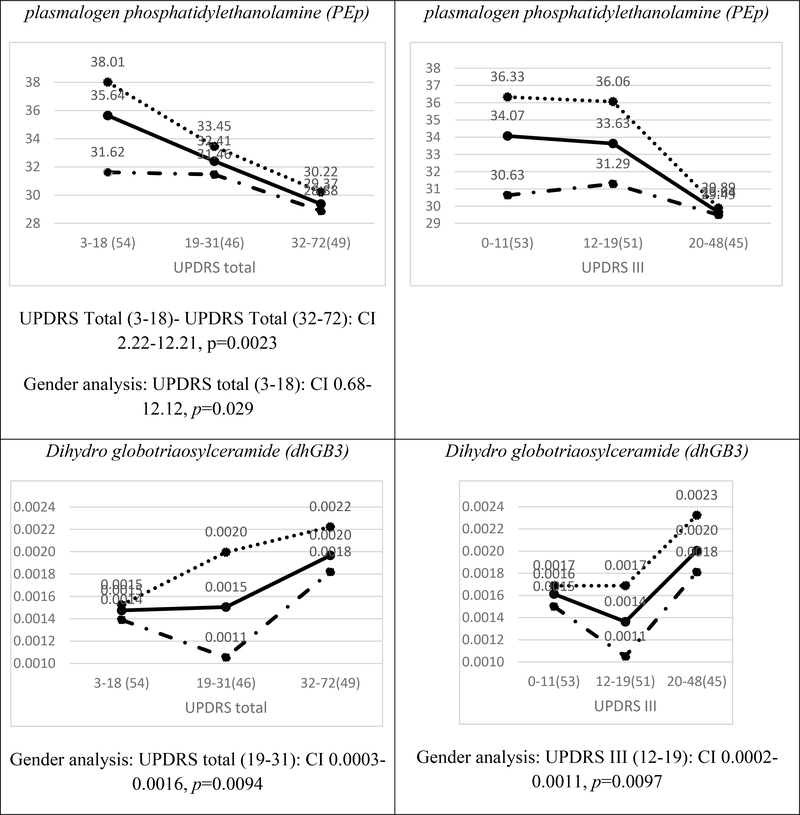
Results: Specific lipid classes dihydrosphingomyelin (dhSM), plasmalogen phosphatidylethanolamine (PEp), glucosylceramide (GlcCer), dihydro globotriaosylceramide (dhGB3), and to a lesser degree dihydro GM3 ganglioside (dhGM3), as well as species dhSM(20:0), PEp(38:6), PEp(42:7), GlcCer(16:0), GlcCer(24:1), dhGM3(22:0), dhGM3(16:0), and dhGB3(16:0) contribute to PD severity prediction of UPDRS III score. These, together with age, age at onset, and disease duration, also contribute to prediction of UPDRS total score. We demonstrate that certain lipid classes and species interrelate differently with the degree of severity of motor symptoms between men and women, and that predicting intermediate disease stages is more accurate than predicting less or more severe stages.

Conclusion: Using machine-learning algorithms and methodologies, we identified lipid signatures that enable prediction of motor severity in PD. Future studies should focus on identifying the biological mechanisms linking GlcCer, dhGB3, dhSM, and PEp with PD severity.

Keywords: PD severity; Parkinson’s disease (PD); UPDRS; lipidome; lipidomics; machine learning.


Conflict of interest statement

Conflict of interest

The authors have no conflict of interest to report.

Figures

FIG. 1.
FIG. 1.
Average plasma concentrations (pmol/μl) for different ranges of the UPDRS total score (left) and UPDRS III score (right) for four contributory lipid classes common to UPDRS total and III scores (Table 3). Numbers in parentheses indicate numbers of observations (patients) in different ranges of severities. The solid, dotted, and broken lines represent all patients, female patients, and male patients, respectively. The distributions of females and males over UPDRS III and UPDRS total scores ranges are given at the top of the figure. The confidence interval (CI) results for multi comparisons between the severities are based on a post-hoc Tukey HSD test and those between females and males on a two-sample t-test [both CIs are presented below each plot only for statistically significant (p<0.05) differences].
FIG. 1.
FIG. 1.
Average plasma concentrations (pmol/μl) for different ranges of the UPDRS total score (left) and UPDRS III score (right) for four contributory lipid classes common to UPDRS total and III scores (Table 3). Numbers in parentheses indicate numbers of observations (patients) in different ranges of severities. The solid, dotted, and broken lines represent all patients, female patients, and male patients, respectively. The distributions of females and males over UPDRS III and UPDRS total scores ranges are given at the top of the figure. The confidence interval (CI) results for multi comparisons between the severities are based on a post-hoc Tukey HSD test and those between females and males on a two-sample t-test [both CIs are presented below each plot only for statistically significant (p<0.05) differences].
FIG. 2.
FIG. 2.
(A) Radar plot representing UPDRS III scrores and average values of the most contributing lipid classes (Table 3), age, AAO, and gender for three PD stages: early (low severity; yellow), intermediate (red), and late (high severity; blue) in comparison to control (green). The controls are 100 subjects genetically unrelated frequency-matched by gender and age (Avg.=66.11 years, std.=9.4) with average and std. BMI values of 25.7 and 4.4, respectively. AAO for the control was set to the value of the low severity. Numbers in parentheses indicate numbers of observations (patients). As we move along an axis from the center/origin of the outer polygon to any of its vertices, the corresponding variable increases its value, e.g., towards higher age, AAO, and lipid class concentrations (and for higher percentages of men than women for the gender variable). The figure demonstrates differences between PD patient groups in three tertiles of UPDRS III scores of 0–11 (lower tertile), 12–20 (middle tertile), and 21–48 (upper tertile) in comparison to control. Among the patients, early stage patients (lowest tertile), mostly women, are recognized by the lowest values of GlcCer (and, of course, of age and AAO values), with extreme values of dhSM, PEp, and PE; the latter value is extremely larger than those of the intermediate and late stage patients (and similar to that of control). Patients with intermediate UPDRS III scores (middle tertile) have dhSM and PEp values similar to those of early stage patients, but also the highest levels of GlcCer and lowest levels of dhGB3. The patients with the highest UPDRS III scores (upper tertile), as expected, are older and have higher AAO values, highest levels of dhGB3, intermediate levels of GlcCer, and PE, and the lowest values of PEp and dhSM. When considering also the control group, we notice two results: a) a perfect order of values from control to low, intermediate, and up to high severities for dhSM and almost perfect order for GlcCer and PE (the two highest severities swapped their order although are very similar in values), and b) for most lipid classes (except PEp and dhGB3), lipid levels of controls are at the extreme ends, i.e., having either the lowest or highest level. (B) Similar to (A) for a combination of average (over the patients) values of dhGM3 and its most contributing species. The figure shows that patients in the lower UPDRS III score tertile have the highest values of dhGM3, dhGM3(22:0), and dhGM3(22:1) but the lowest values of dhGM3(16:0). The case is nearly opposite for patients in the highest UPDRS III score tertile, i.e., the lowest values of dhGM3, dhGM3(22:0), and dhGM3(22:1), and relatively high values of dhGM3(16:0). Interestingly, while the intermediate disease severity is characterized by intermediate values of dhGM3, dhGM3(22:0), and dhGM3(22:1), it is also characterized by the highest values of dhGM3(16:0). (C) Similar to (A) for a combination of average (over the patients) values of GlcCer and its most contributing species together with age and AAO. The figure shows patients in the higher tertile of UPDRS III scores were older with later AAOs, but also had the highest values of GlcCer(16:0) and relatively high values of GlcCer and all of its other species. On the other hand, patients with the lowest UPDRS III scores are the youngest with the lowest AAO on average and have the lowest values of GlcCer and its species, except for GlcCer(24:1), where these patients have the highest plasma levels. (D) The same as (C) including the control group for a reference (the small values of the control subjects changed the scale drastically so previous differences among PD severities were diminished), showing that none of the species of the GlcCer class is expressed in the control subjects, and thereby emphasizing the role of this lipid class in PD (C).
FIG. 2.
FIG. 2.
(A) Radar plot representing UPDRS III scrores and average values of the most contributing lipid classes (Table 3), age, AAO, and gender for three PD stages: early (low severity; yellow), intermediate (red), and late (high severity; blue) in comparison to control (green). The controls are 100 subjects genetically unrelated frequency-matched by gender and age (Avg.=66.11 years, std.=9.4) with average and std. BMI values of 25.7 and 4.4, respectively. AAO for the control was set to the value of the low severity. Numbers in parentheses indicate numbers of observations (patients). As we move along an axis from the center/origin of the outer polygon to any of its vertices, the corresponding variable increases its value, e.g., towards higher age, AAO, and lipid class concentrations (and for higher percentages of men than women for the gender variable). The figure demonstrates differences between PD patient groups in three tertiles of UPDRS III scores of 0–11 (lower tertile), 12–20 (middle tertile), and 21–48 (upper tertile) in comparison to control. Among the patients, early stage patients (lowest tertile), mostly women, are recognized by the lowest values of GlcCer (and, of course, of age and AAO values), with extreme values of dhSM, PEp, and PE; the latter value is extremely larger than those of the intermediate and late stage patients (and similar to that of control). Patients with intermediate UPDRS III scores (middle tertile) have dhSM and PEp values similar to those of early stage patients, but also the highest levels of GlcCer and lowest levels of dhGB3. The patients with the highest UPDRS III scores (upper tertile), as expected, are older and have higher AAO values, highest levels of dhGB3, intermediate levels of GlcCer, and PE, and the lowest values of PEp and dhSM. When considering also the control group, we notice two results: a) a perfect order of values from control to low, intermediate, and up to high severities for dhSM and almost perfect order for GlcCer and PE (the two highest severities swapped their order although are very similar in values), and b) for most lipid classes (except PEp and dhGB3), lipid levels of controls are at the extreme ends, i.e., having either the lowest or highest level. (B) Similar to (A) for a combination of average (over the patients) values of dhGM3 and its most contributing species. The figure shows that patients in the lower UPDRS III score tertile have the highest values of dhGM3, dhGM3(22:0), and dhGM3(22:1) but the lowest values of dhGM3(16:0). The case is nearly opposite for patients in the highest UPDRS III score tertile, i.e., the lowest values of dhGM3, dhGM3(22:0), and dhGM3(22:1), and relatively high values of dhGM3(16:0). Interestingly, while the intermediate disease severity is characterized by intermediate values of dhGM3, dhGM3(22:0), and dhGM3(22:1), it is also characterized by the highest values of dhGM3(16:0). (C) Similar to (A) for a combination of average (over the patients) values of GlcCer and its most contributing species together with age and AAO. The figure shows patients in the higher tertile of UPDRS III scores were older with later AAOs, but also had the highest values of GlcCer(16:0) and relatively high values of GlcCer and all of its other species. On the other hand, patients with the lowest UPDRS III scores are the youngest with the lowest AAO on average and have the lowest values of GlcCer and its species, except for GlcCer(24:1), where these patients have the highest plasma levels. (D) The same as (C) including the control group for a reference (the small values of the control subjects changed the scale drastically so previous differences among PD severities were diminished), showing that none of the species of the GlcCer class is expressed in the control subjects, and thereby emphasizing the role of this lipid class in PD (C).
FIG. 3.
FIG. 3.
Average plasma concentrations (pmol/μl) for different ranges of the UPDRS III score for species that were identified among the eighteenth important ones (Table 4). The solid line represents all the PD patients. Numbers in parentheses indicate numbers of observations (patients) in different ranges of severities. The dotted line represents female patients and the broken line the male. The distributions of females and males over UPDRS score ranges are given at the top of the figure. The CI results for the comparisons between the severities are based on a post hoc Tukey HSD test and those between females and males on a two-sample [both Cis t-test, are presented below each plot only for statistically significant (p<0.05) differences.]. Note that dhGB3(16:0) is the only species in the dhGB3 class, what explains the identity between the corresponding figures here and in Figure 1.
FIG. 3.
FIG. 3.
Average plasma concentrations (pmol/μl) for different ranges of the UPDRS III score for species that were identified among the eighteenth important ones (Table 4). The solid line represents all the PD patients. Numbers in parentheses indicate numbers of observations (patients) in different ranges of severities. The dotted line represents female patients and the broken line the male. The distributions of females and males over UPDRS score ranges are given at the top of the figure. The CI results for the comparisons between the severities are based on a post hoc Tukey HSD test and those between females and males on a two-sample [both Cis t-test, are presented below each plot only for statistically significant (p<0.05) differences.]. Note that dhGB3(16:0) is the only species in the dhGB3 class, what explains the identity between the corresponding figures here and in Figure 1.
FIG. 4.
FIG. 4.
Average prediction RMSE values for UPDRS III and UDPRS total scores and relatively equally populated UPDRS III score ranges. RMSE=1nj=1n(yjy^j)2, where n is the number of observations (patients), yj is the actual UPDRS total and UPDRS III scores for the jth patient, and y^j is the corresponding predicted value. Numbers in parentheses indicate numbers of patients for different severity ranges. The figure presents the RMSE of the RF trained using the most contributing lipid species (Tables 4 and 5) in eight ranges of UPDRS III score severities. While the average RMSE for UPDRS III and UPDRS total scores for all 149 patients is 6.81 and 9.42, respectively (not shown in the figure), the figure shows that for 50% (75) of the patients, those with UPDRS III score between 9 to 22 (the four middle severity ranges), the average RMSE in predicting UPDRS III score is between 2.85 and 5.72, and that in predicting UPDRS total score is between 4.48 and 7.56. These RMSE values are much smaller than the 9.3 and 13.8 standard deviations of UPDRS III and UPDRS total scores in our data, respectively (Table 2). For another 25% (38) of the patients, in severity ranges of 6–8 and 23–26, the average error is between 7.07 and 7.57 for UPDRS III score and between 9.79 and 10.11 for UPDRS total score, which are also smaller compared with the corresponding 9.3/13.8 standard deviations. However, for extreme (low and high) UPDRS III score, 24% (36) of the patients have average error higher than the standard deviation, which is attributed to the high variance of, and outliers in, RMSE in these severity ranges (Supplementary Figure S2). Also note from comparing the graphs for UPDRS total and UPDRS III scores, that errors due to UPDRS I and UPDRS II scores (the difference between UPDRS total and III scores) are greater for extreme severity values.

References

    1. Ryckman AE, Brockhausen I, Walia JS (2020) Metabolism of Glycosphingolipids and Their Role in the Pathophysiology of Lysosomal Storage Disorders. Int J Mol Sci 21. - PMC - PubMed
    1. Murphy KE, Halliday GM (2014) Glucocerebrosidase deficits in sporadic Parkinson disease. Autophagy 10, 1350–1351. - PMC - PubMed
    1. Kim MJ, Jeon S, Burbulla LF, Krainc D (2018) Acid ceramidase inhibition ameliorates alpha-synuclein accumulation upon loss of GBA1 function. Hum Mol Genet 27, 1972–1988. - PMC - PubMed
    1. Chan RB, Perotte AJ, Zhou B, Liong C, Shorr EJ, Marder KS, Kang UJ, Waters CH, Levy OA, Xu Y, Shim HB, Pe’er I, Di Paolo G, Alcalay RN (2017) Elevated GM3 plasma concentration in idiopathic Parkinson’s disease: A lipidomic analysis. PLoS One 12, e0172348. - PMC - PubMed
    1. Di Pasquale E, Fantini J, Chahinian H, Maresca M, Taieb N, Yahi N (2010) Altered ion channel formation by the Parkinson’s-disease-linked E46K mutant of alpha-synuclein is corrected by GM3 but not by GM1 gangliosides. J Mol Biol 397, 202–218. - PubMed