

Radiographic findings in COVID-19: Comparison between AI and radiologist
- PMID: 33814766
- PMCID: PMC7996692
- DOI: 10.4103/ijri.IJRI_777_20
Radiographic findings in COVID-19: Comparison between AI and radiologist
Abstract
Context: As the burden of COVID-19 enhances, the need of a fast and reliable screening method is imperative. Chest radiographs plays a pivotal role in rapidly triaging the patients. Unfortunately, in low-resource settings, there is a scarcity of trained radiologists.
Aim: This study evaluates and compares the performance of an artificial intelligence (AI) system with a radiologist in detecting chest radiograph findings due to COVID-19.
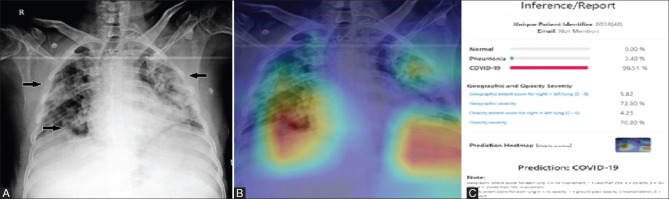
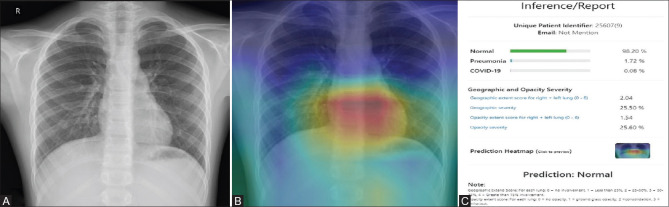
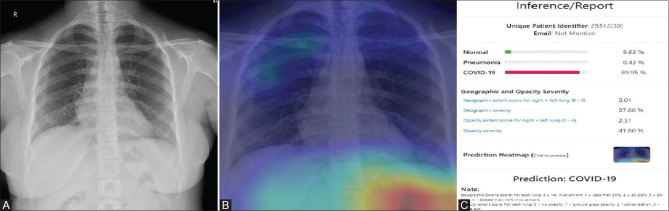
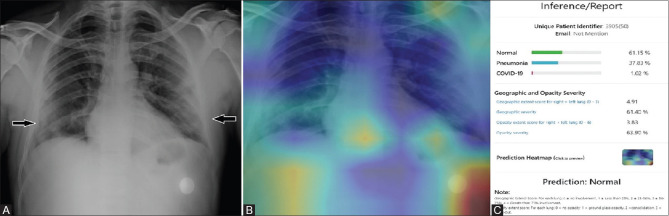
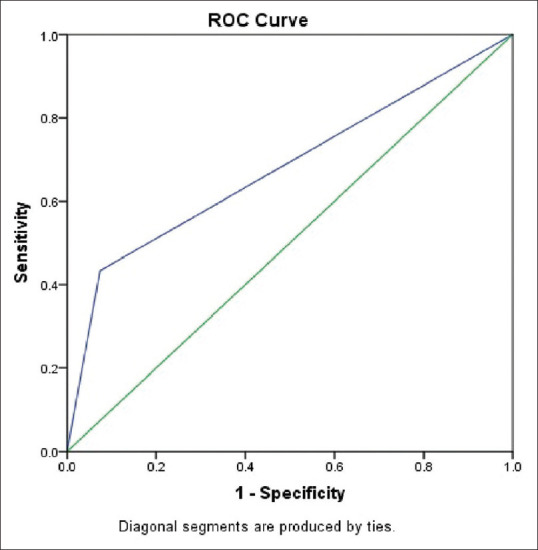
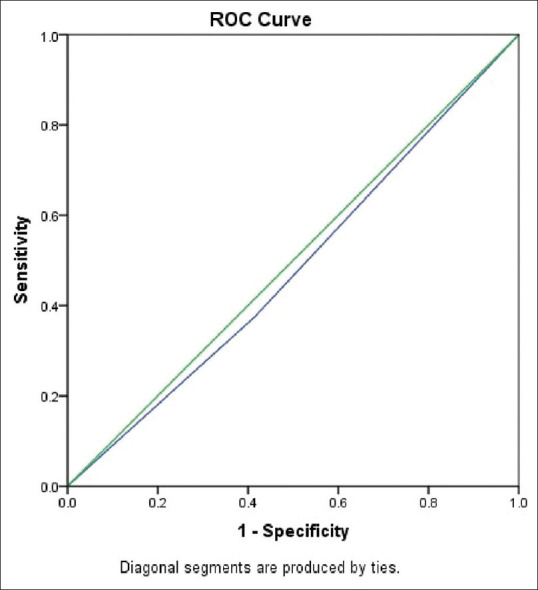
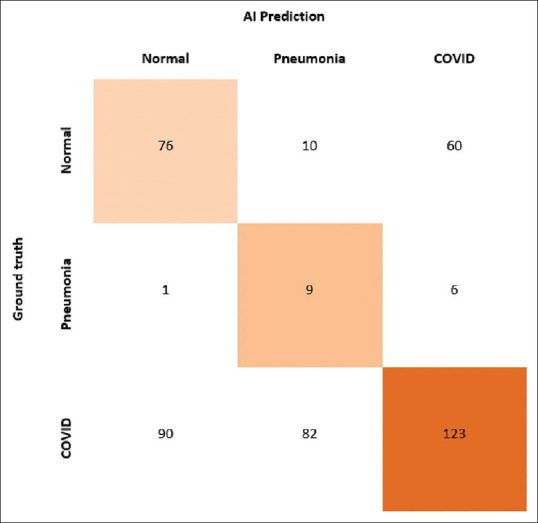
Subjects and methods: The test set consisted of 457 CXR images of patients with suspected COVID-19 pneumonia over a period of three months. The radiographs were evaluated by a radiologist with experience of more than 13 years and by the AI system (NeuraCovid, a web application that pairs with the AI model COVID-NET). Performance of AI system and the radiologist were compared by calculating the sensitivity, specificity and generating a receiver operating characteristic curve. RT-PCR test results were used as the gold standard.
Results: The radiologist obtained a sensitivity and specificity of 44.1% and 92.5%, respectively, whereas the AI had a sensitivity and specificity of 41.6% and 60%, respectively. The area under curve for correctly classifying CXR images as COVID-19 pneumonia was 0.48 for the AI system and 0.68 for the radiologist. The radiologist's prediction was found to be superior to that of the AI with a P VALUE of 0.005.
Conclusion: The specificity and sensitivity of detecting lung involvement in COVID-19, by the radiologist, was found to be superior to that by the AI system.
Keywords: Artificial intelligence; COVID pneumonia; chest radiographs; rapid triaging.
Copyright: © 2021 Indian Journal of Radiology and Imaging.
Conflict of interest statement
There are no conflicts of interest.
Figures
References
-
- Meo SA, Alhowikan AM, Al-Khlaiwi T, Meo IM, Halepoto DM, Iqbal M, et al. Novel coronavirus 2019-nCoV: prevalence, biological and clinical characteristics comparison with SARS-CoV and MERS-CoV. Eur Rev Med Pharmacol Sci. 2020;24:2012–9. - PubMed
-
- WHO's Certified [Internet]. Pneumonia of unknown cause–China’, Emergencies preparedness, response. Disease outbreak news. Cited on 2020 Sept 9. Available from: https://www.who.int/csr/don/05-january-2020-pneumonia-of-unkown-cause-ch...
-
- Worldometers.info[Internet].COVID-19 coronavirus pandemic. Updated on 2020 Sept 18; Cited on 2020 Sept 18. Available at: https://www.worldometers.info/coronavirus/
LinkOut - more resources
Full Text Sources
Other Literature Sources
Research Materials