. 2023;27(3):807-830.
doi: 10.1007/s00779-021-01530-7. Epub 2021 Mar 26.

Forecasting major impacts of COVID-19 pandemic on country-driven sectors: challenges, lessons, and future roadmap

Affiliations

Forecasting major impacts of COVID-19 pandemic on country-driven sectors: challenges, lessons, and future roadmap

Saket Kumar et al. Pers Ubiquitous Comput. 2023.

Abstract

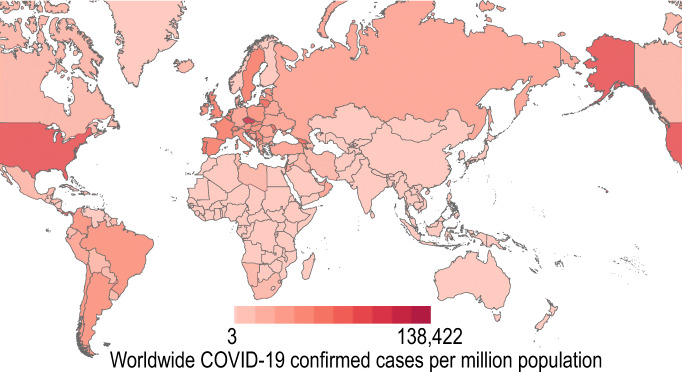
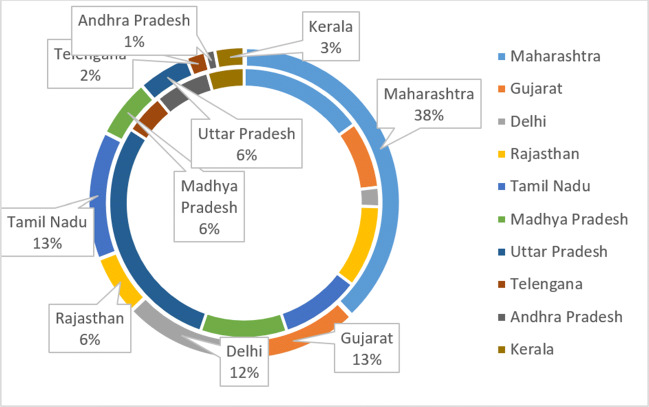
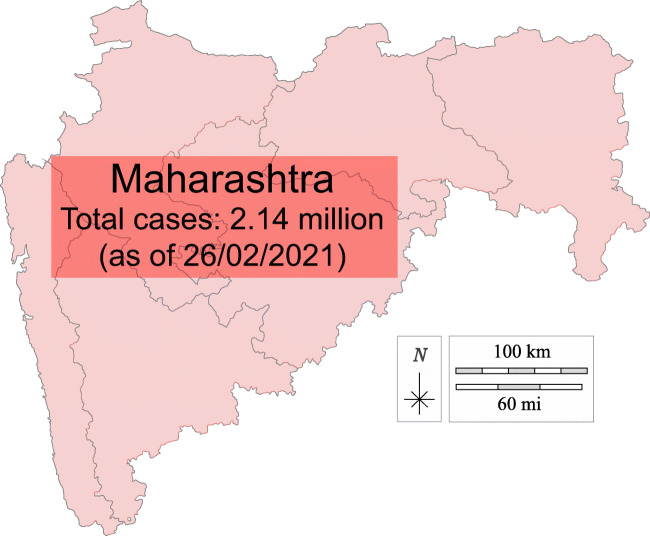
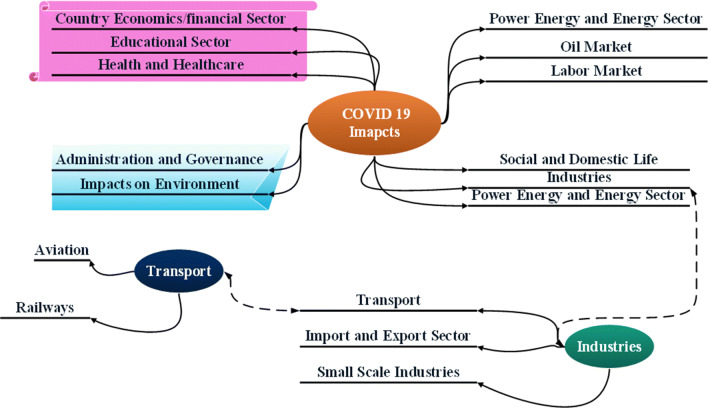
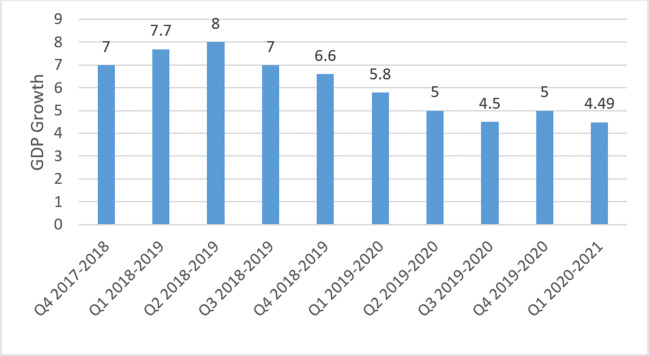
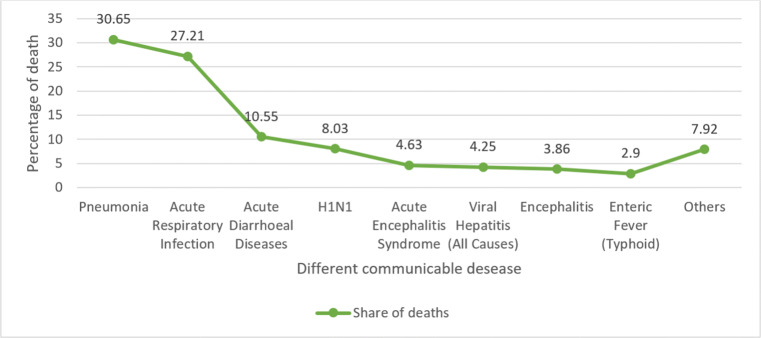
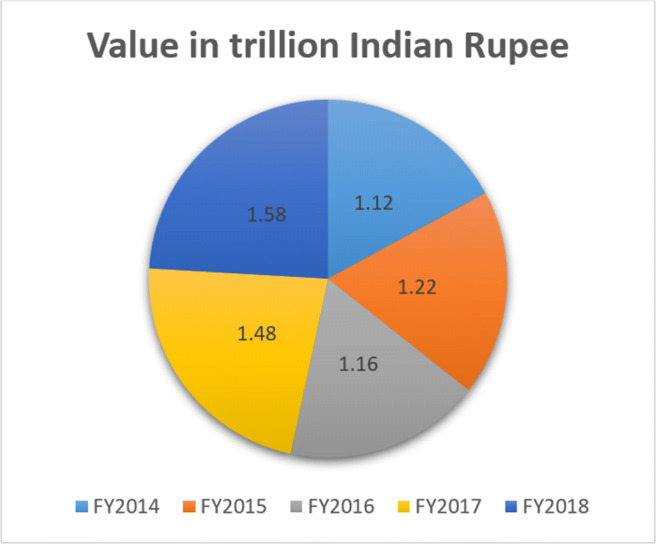
The pandemic caused by the coronavirus disease 2019 (COVID-19) has produced a global health calamity that has a profound impact on the way of perceiving the world and everyday lives. This has appeared as the greatest threat of the time for the entire world in terms of its impact on human mortality rate and many other societal fronts or driving forces whose estimations are yet to be known. Therefore, this study focuses on the most crucial sectors that are severely impacted due to the COVID-19 pandemic, in particular reference to India. Considered based on their direct link to a country's overall economy, these sectors include economic and financial, educational, healthcare, industrial, power and energy, oil market, employment, and environment. Based on available data about the pandemic and the above-mentioned sectors, as well as forecasted data about COVID-19 spreading, four inclusive mathematical models, namely-exponential smoothing, linear regression, Holt, and Winters, are used to analyse the gravity of the impacts due to this COVID-19 outbreak which is also graphically visualized. All the models are tested using data such as COVID-19 infection rate, number of daily cases and deaths, GDP of India, and unemployment. Comparing the obtained results, the best prediction model is presented. This study aims to evaluate the impact of this pandemic on country-driven sectors and recommends some strategies to lessen these impacts on a country's economy.

Keywords: COVID-19 impact; Corona virus; Forecast affect; Mathematical modelling.


Conflict of interest statement

Conflict of interestThe authors declare no competing interests.

Figures

Fig. 1
Fig. 1
COVID-19 spread worldwide
Fig. 2
Fig. 2
Top 20 countries that are affected by COVID-19
Fig. 3
Fig. 3
State wise analysis of India for the confirmed cases and number of deaths
Fig. 4
Fig. 4
Infected people in top ten populated states in India
Fig. 5
Fig. 5
Corona threats in Maharashtra state of India. Modified from [33]
Fig. 6
Fig. 6
COVID-19 threats map of India. Modified from [33]
Fig. 7
Fig. 7
Detailed classification of chart of major impacts (considered in this study)
Fig. 8
Fig. 8
GDP rate of last 5 years of Indian economics
Fig. 9
Fig. 9
Death in 2018 due to different communicable diseases in past year
Fig. 10
Fig. 10
Total expenditure on health and healthcare sector by Indian government from FY 2014 to 2018
Fig. 11
Fig. 11
Impact on different parts of industries in India due to COVID-19 and lockdown. Modified from [38]
Fig. 12
Fig. 12
Export income of India from April 2019 to March 2020
Fig. 13
Fig. 13
Brent and WTI Crude Oil Spot Price fall down globally [43]
Fig. 14
Fig. 14
Energy demand (MU) between 25 March and 31 March 2020 of India [45]
Fig. 15
Fig. 15
Share of market sections in total electricity generation 2018–2019
Fig. 16
Fig. 16
The average NO2 emission data of five metros cities of India during lockdown. Modified from [51]
Fig. 17
Fig. 17
Prediction of daily cases with different models and compared with actual data
Fig. 18
Fig. 18
Total infected cases until 14 May 2020 and prediction for next 2 months in India
Fig. 19
Fig. 19
Total daily cases encountered until 14 May 2020 and prediction of every day cases encountered in India for next 2 months
Fig. 20
Fig. 20
Total deaths encountered until 14 May 2020 and prediction of death encountered in India for next 2 months
Fig. 21
Fig. 21
Effect on GDP of India due to COVID-19 attack and prediction of GDP for next 8 quarters
Fig. 22
Fig. 22
Effect on unemployment in India from 2013 to 2021. The graph shows quarter result

References

    1. Tomar A, Gupta N (2020) Prediction for the spread of COVID-19 in India and effectiveness of preventive measures. Sci Total Environ 138762 - PMC - PubMed
    1. Ahmed W, Angel N, Edson J, Bibby K, Bivins A, O’Brien JW et al (2020) First confirmed detection of SARS-cov-2 in untreated wastewater in australia: a proof of concept for the wastewater surveillance of COVID-19 in the community. Sci Total Environ 138764 - PMC - PubMed
    1. Vellingiri B, Jayaramayya K, Iyer M, Narayanasamy A, Govindasamy V, Giridharan B et al (2020) COVID-19: a promising cure for the global panic. Sci Total Environ 138277 - PMC - PubMed
    1. Worldometers (2020) Coronavirus graphs: worldwide cases and deaths - Worldometer. [Accessed 12 Oct 2020]. Available from: https://www.worldometers.info/coronavirus/worldwide-graphs/
    1. Mahmud M, Kaiser MS, McGinnity M, Hussain A (2021) Deep learning in mining biological data. Cogn Comput. 1–33. [epub ahead of print]. Available from: 10.1007/s12559-020-09773-x - PMC - PubMed

LinkOut - more resources