Review
. 2021 Mar 19:15:610957.
doi: 10.3389/fnins.2021.610957. eCollection 2021.

Impaired Binaural Hearing in Adults: A Selected Review of the Literature

Affiliations
Review

Impaired Binaural Hearing in Adults: A Selected Review of the Literature

Frederick J Gallun. Front Neurosci. .

Abstract

Despite over 100 years of study, there are still many fundamental questions about binaural hearing that remain unanswered, including how impairments of binaural function are related to the mechanisms of binaural hearing. This review focuses on a number of studies that are fundamental to understanding what is known about the effects of peripheral hearing loss, aging, traumatic brain injury, strokes, brain tumors, and multiple sclerosis (MS) on binaural function. The literature reviewed makes clear that while each of these conditions has the potential to impair the binaural system, the specific abilities of a given patient cannot be known without performing multiple behavioral and/or neurophysiological measurements of binaural sensitivity. Future work in this area has the potential to bring awareness of binaural dysfunction to patients and clinicians as well as a deeper understanding of the mechanisms of binaural hearing, but it will require the integration of clinical research with animal and computational modeling approaches.

Keywords: auditory; binaural; impairment; lateralization; localization; spatial hearing.


Conflict of interest statement

The author declares that the research was conducted in the absence of any commercial or financial relationships that could be construed as a potential conflict of interest.

Figures
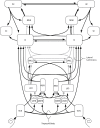
FIGURE 1
FIGURE 1
Major nuclei (boxes) and primarily excitatory (lines with arrows) or inhibitory (lines with squares) interconnections of the ascending auditory pathway, with an emphasis on binaural function and connectivity, as described in the text: VCN: ventral cochlear nucleus, MNTB: medial nucleus of the trapezoid body, LNTB: lateral nucleus of the trapezoid body, MSO: medial nucleus of the superior olivary complex, LSO: lateral nucleus of the superior olivary complex, DNLL: dorsal nucleus of the lateral lemniscus, IC: inferior colliculus, SC: superior colliculus, MGB: medial geniculate body of the thalamus, AC: auditory cortex. Additional nuclei, projections, and subdivisions are omitted for clarity. Reproduced from Stecker and Gallun (2012), in Translational Perspectives in Auditory Neuroscience: Normal Aspects of Hearing (p. 395) by Tremblay, K., & Burkard, R. Copyright© 2012 Plural Publishing, Inc. All rights reserved. Used with permission.
FIGURE 2
FIGURE 2
Example of a loudspeaker array used to test localization ability by identification of the loudspeaker from which a test signal has been presented. Such arrays can also be used to test spatial release from masking with speech or other stimuli. See text for experimental details. Reproduced with permission from Brungart et al. (2017). Copyright 2017, Acoustical Society of America.
FIGURE 3
FIGURE 3
Schematic diagram of the time-amplitude waveforms of a dichotic FM stimulus. For illustration purposes, the carrier frequency has been reduced and modulation depth increased from the values that would be used experimentally. Note that while there is no onset or offset difference in amplitude or phase, the phases of the signals at the left and right ears (top and bottom waveforms) are continually changing, resulting in an interaural phase difference that changes over time and an interaural time difference that shifts from left-leading to right-leading and back again. Reproduced under Creative Commons reuse license from Koerner et al. (2020).
FIGURE 4
FIGURE 4
Example of a stimulus that shifts from diotic to dichotic (A) and the evoked response generated in the time domain (P1-N1-P2 complex; B) and frequency domain (IPM-FR; C,D). See text for further details. Note that the stimulus shown shifts from diotic to dichotic and back to diotic, while the stimulus that would be used to evoke the P1-N1-P2 complex shown in panel (B) would only shift once, from diotic to dichotic, at the temporal midpoint of the stimulus. The stimulus used to generate the IPM-FR would contain many such alternations, at a characteristic rate, usually between 5 and 10 Hz. The arrows in panels (C,D) indicate the frequency at which the stimulus used to generate the IPM-FR alternated from diotic to dichotic, which in this case was 6.8 Hz. Additional evoked responses shown in panel (B) indicate the onset and the offset of the signal, while those in panels (C,D) indicate the response to the amplitude modulation rate (81.6 Hz) of the 500 Hz carrier. Additional low-frequency peaks in panel (C) represent aliasing at integer multiples of the IPM rate of 6.8 Hz. Panel (D) shows the response to a diotic stimulus and thus does not contain the peaks indicating the presence of the IPM-FR but does show the response to the modulation of the carrier amplitude at 81.6 Hz. Reproduced with permission from Ross et al. (2007); Vercammen et al. (2018), and Koerner et al. (2020). Vercammen et al. copyright 2018, Sage Publications. Ross et al. copyright Journal of Neuroscience. Koerner et al. reused under Creative Commons license.
FIGURE 5
FIGURE 5
Summary plot of the differences between localization accuracy for normally hearing and hearing-impaired listeners for 29 studies review by Akeroyd and Whitmer (2016). The dashed line indicates similar acuity for those with and without peripheral impairment. Reproduced with permission from Akeroyd and Whitmer (2016). Copyright 2016, Springer Nature.
FIGURE 6
FIGURE 6
Interaural time difference (A) and ILD (B) values associated with JND thresholds for a 0.5 kHz narrowband noise. Data are shown for normally hearing (filled symbols) and hearing-impaired (open symbols) listeners as a function of SL. Note that the normally hearing listeners repeated the task at both a high and a low SL, while the impaired group were tested at a single level from which SL was calculated. Reproduced with permission from Smith-Olinde et al. (2004). Copyright 2004, American Speech-Language-Hearing Association.
FIGURE 7
FIGURE 7
Masking level difference as a function of pure-tone detection threshold at 500 Hz for listeners with symmetrical hearing losses across ears (A) and the amount of asymmetry in pure-tone detection thresholds between ears at 500 Hz for listeners with unilateral losses (B). Data are shown for 28 participants with conductive loss in panel (A), 48 participants with conductive loss in panel (B), 71 participants with sensorineural hearing loss in panel (A), and 55 participants with sensorineural hearing loss in panel (B). For comparison purposes, the relevant data from McFadden (1968), in which normally hearing listeners detected signals of various levels are also plotted in each panel. Reproduced with permission from Jerger et al. (1984). Copyright 1984, American Medical Association. All rights reserved.
FIGURE 8
FIGURE 8
Data and modeling reproduced with permission from Baltzell et al. (2020). Copyright 2020, Acoustical Society of America. Relationships between ITD threshold and BRM as a function of interaural correlation (r) of the stimuli tested are shown in panel (A), and the deviation in dB between the best-fitting line for the listeners with normal hearing [open circles in panel (A)] and the values for the hearing-impaired listeners [filled symbols in panel (A)] are plotted in panel (B). Values of r are indicated by color of the symbols in panel (A), and gray symbols indicate points for which the ITD was unmeasurable. One listener, who had an unmeasurable threshold for an interaural correlation of 1, was excluded from the analysis and is not included in the figure. See text for further details.
FIGURE 9
FIGURE 9
The relationship between age and localization accuracy for two narrowband signals: 250–500 Hz (black diamonds) and 1,250–1,575 Hz (gray triangles). Dotted lines indicate linear regressions associated with the equations shown. Data and modeling reproduced with permission from Dobreva et al. (2011). Copyright 2011, American Physiological Society.
FIGURE 10
FIGURE 10
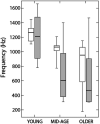
Data indicate the highest carrier frequency at which listeners in three age groups could discriminate diotic from dichotic stimuli. Open rectangles show data from Grose and Mamo (2010) and shaded rectangles show data from Ross et al. (2007). See text for further details. Reproduced with permission from Grose and Mamo (2010). Copyright 2010, Wolters Kluwer Health, Inc.
FIGURE 11
FIGURE 11
Model predictions from Gallun et al. (2014) showing the effects of detection threshold for a brief (4 ms) stimulus in peak-equivalent units (peSPL; equivalent level for a 1-s pure tone with the same peak level) on discrimination thresholds. Predictions are shown for a modeled younger listener (20 years; black lines) and a modeled older listener (gray lines). Solid lines are for a broadband stimulus (“chirp”) and dashed lines are for a narrowband stimulus (“tone”). See text for a description of the monaural, binaural, and bilateral tasks. Reproduced with permission from Gallun et al. (2014) under Creative Commons license.
FIGURE 12
FIGURE 12
Auditory evoked responses measured by MEG showing the P1-N1-P2 complex to a change from a diotic to a dichotic stimulus as a function of carrier frequency and age group. Data reproduced with permission from Ross et al. (2007). Copyright 2007, Society for Neuroscience.

References

    1. Abel S. M., Giguère C., Consoli A., Papsin B. C. (2000). The effect of aging on horizontal plane sound localization. J. Acoust. Soc. Am. 108 743–752. - PubMed
    1. Akeroyd M. A., Whitmer W. M. (2016). “Spatial hearing and hearing aids,” in Hearing Aids, eds Popelka G. R., Moore B. C. J., Fay R. R., Popper A. N. (Cham: Springer International Publishing; ), 181–215. 10.1007/978-3-319-33036-5_7 - DOI
    1. Anderson S., Ellis R., Mehta J., Goupell M. J. (2018). Age-related differences in binaural masking level differences: behavioral and electrophysiological evidence. J. Neurophysiol. 120 2939–2952. 10.1152/jn.00255.2018 - DOI - PMC - PubMed
    1. ANSI/ASA S3.6 (2018). Specification for Audiometers. Melville, NY: Acoustical Society of America.
    1. Arbogast T. L., Mason C. R., Kidd G. (2005). The effect of spatial separation on informational masking of speech in normal-hearing and hearing-impaired listeners. J. Acoust. Soc. Am. 117 2169–2180. 10.1121/1.1861598 - DOI - PubMed

LinkOut - more resources