. 2021 Mar 18:12:632132.
doi: 10.3389/fimmu.2021.632132. eCollection 2021.

Anti-Inflammatory (M2) Response Is Induced by a sp2-Iminosugar Glycolipid Sulfoxide in Diabetic Retinopathy

Affiliations

Anti-Inflammatory (M2) Response Is Induced by a sp2-Iminosugar Glycolipid Sulfoxide in Diabetic Retinopathy

Fátima Cano-Cano et al. Front Immunol. .

Abstract

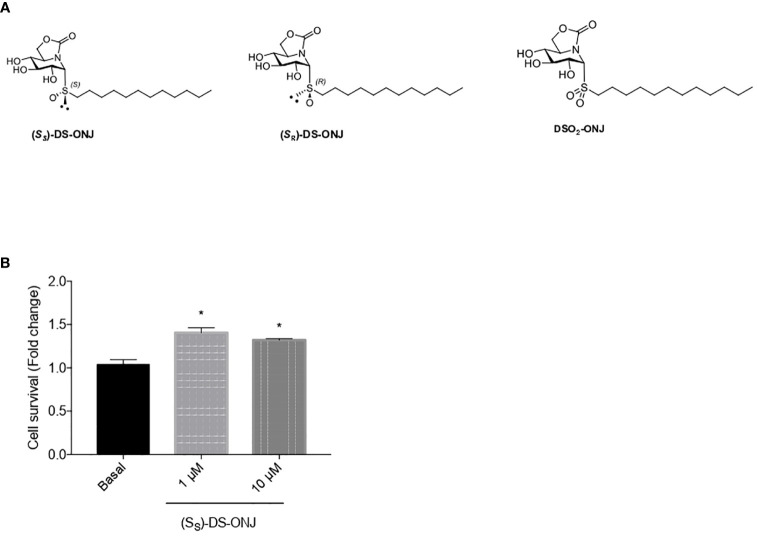
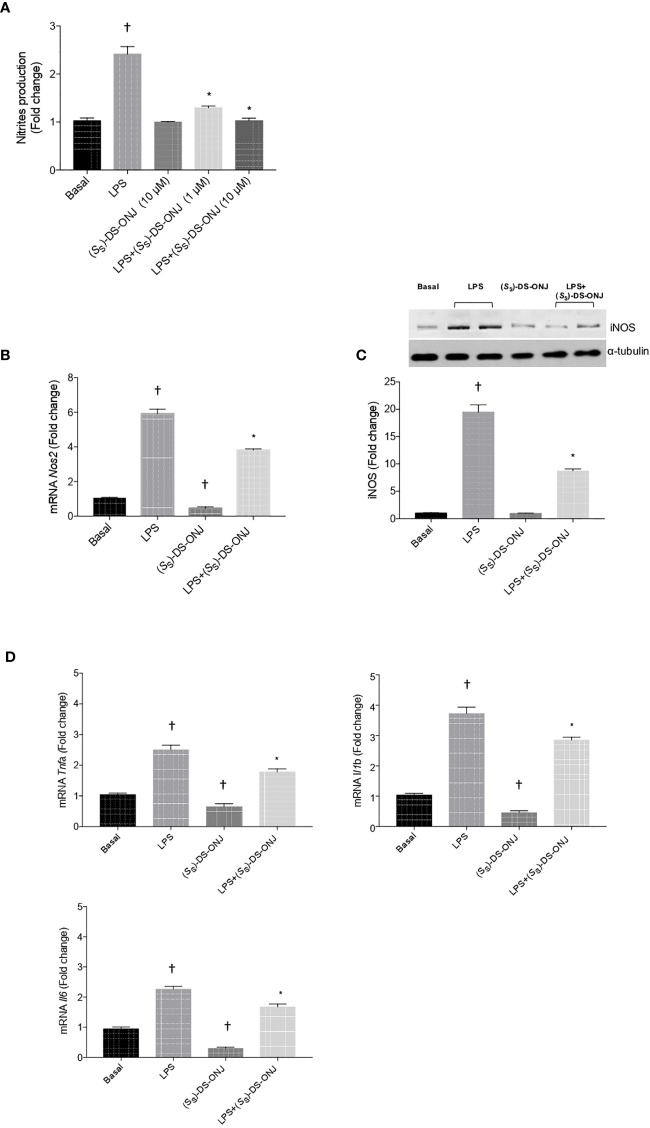
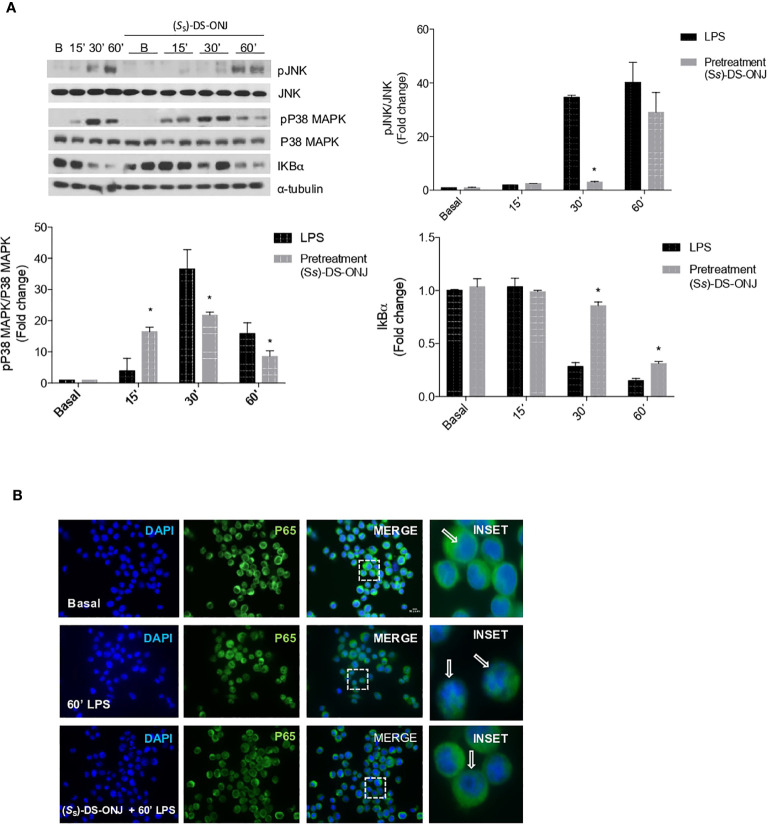
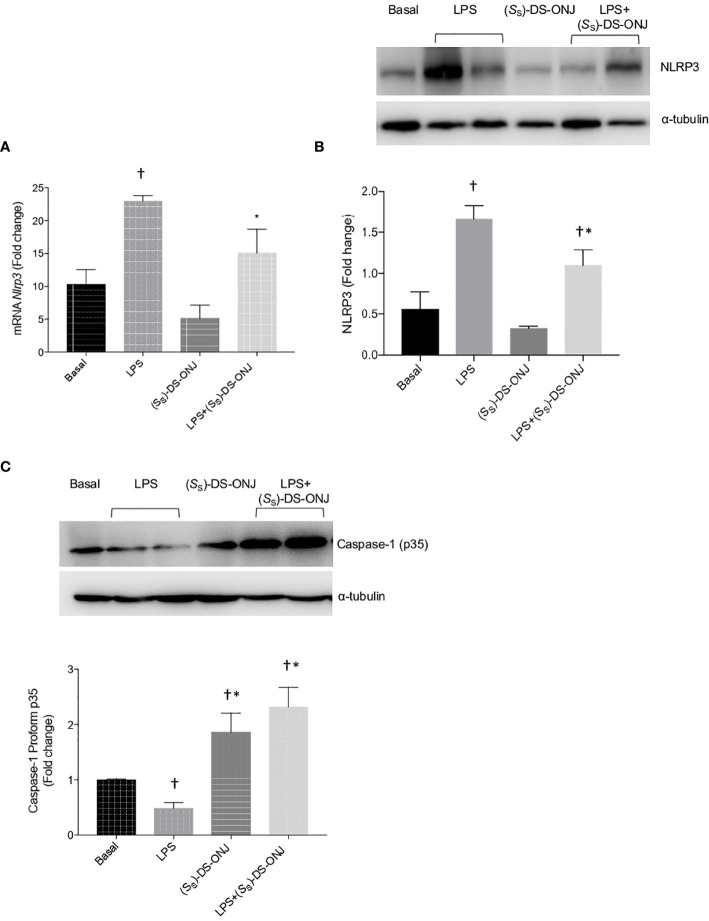
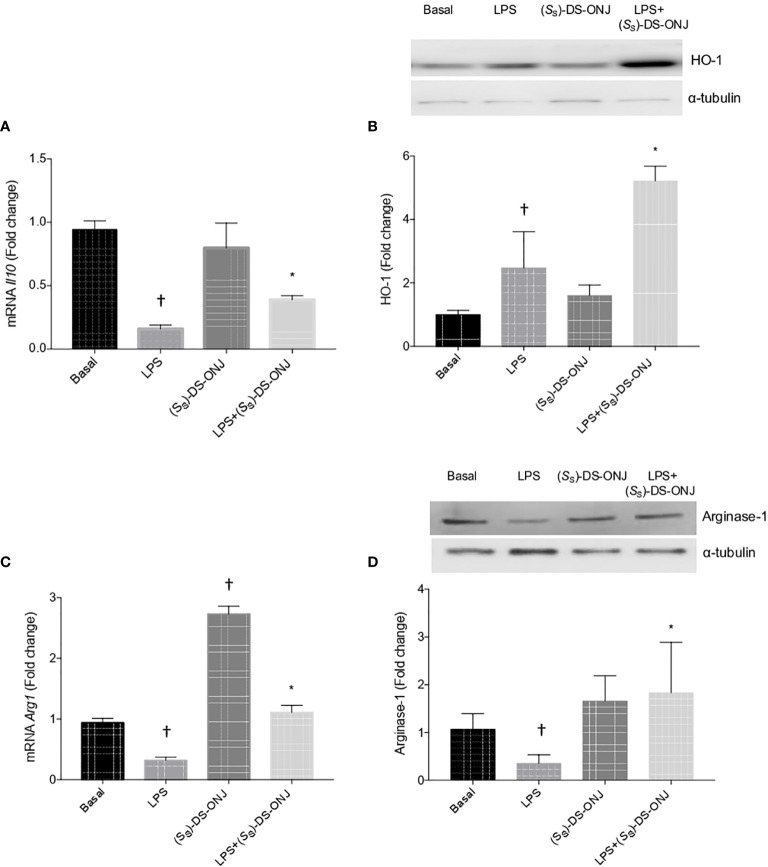
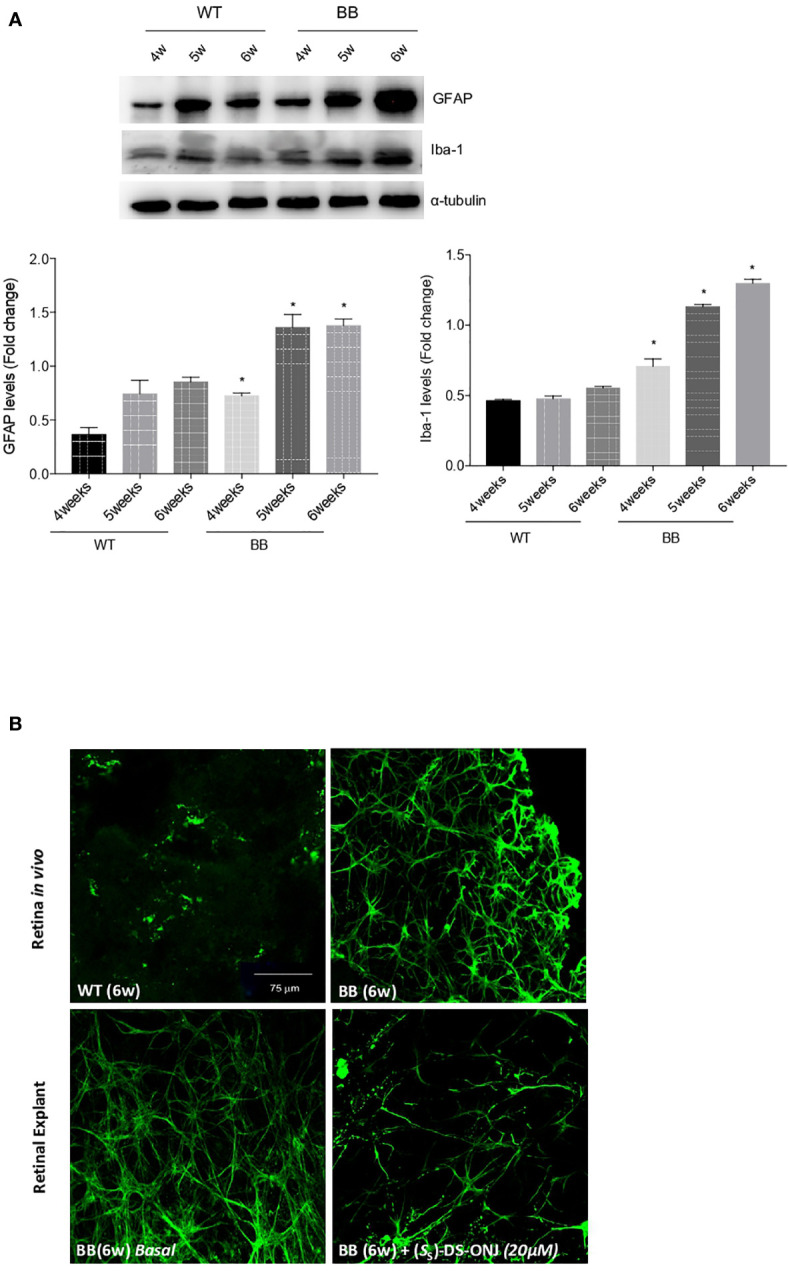
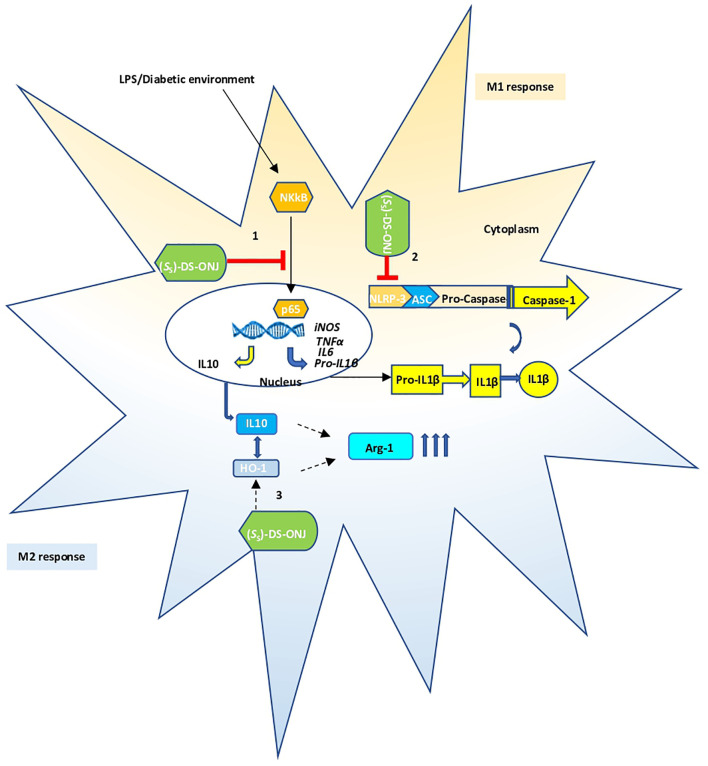
Diabetic retinopathy (DR) is one of the most common complications of Diabetes Mellitus (DM) and is directly associated with inflammatory processes. Currently, neuro-inflammation is considered an early event in DR and proceeds via microglia polarization. A hallmark of DR is the presence of retinal reactive gliosis. Here we report the beneficial effect of (SS,1R)-1-docecylsulfiny-5N,6O-oxomethylidenenojirimycin ((Ss)-DS-ONJ), a member of the sp2-iminosugar glycolipid (sp2-IGL) family, by decreasing iNOS and inflammasome activation in Bv.2 microglial cells exposed to pro-inflammatory stimuli. Moreover, pretreatment with (Ss)-DS-ONJ increased Heme-oxygenase (HO)-1 as well as interleukin 10 (IL10) expression in LPS-stimulated microglial cells, thereby promoting M2 (anti-inflammatory) response by the induction of Arginase-1. The results strongly suggest that this is the likely molecular mechanism involved in the anti-inflammatory effects of (SS)-DS-ONJ in microglia. (SS)-DS-ONJ further reduced gliosis in retinal explants from type 1 diabetic BB rats, which is consistent with the enhanced M2 response. In conclusion, targeting microglia polarization dynamics in M2 status by compounds with anti-inflammatory activities offers promising therapeutic interventions at early stages of DR.

Keywords: M2 response; diabetic retinopathy; immunomodulation; microglia; sp2-iminosugar glycolipids.


Conflict of interest statement

The authors declare that the research was conducted in the absence of any commercial or financial relationships that could be construed as a potential conflict of interest.

Figures

Figure 1
Figure 1
Effect of (S S)-DS-ONJ in the cellular viability in Bv.2 microglial cells. (A) Chemical structures of the sp2-IGLs (S S)-DS-ONJ, (S R)-DS-ONJ and DSO2-ONJ. (B) Bv.2 microglial cells were treated for 24 h with (S S)-DS-ONJ (1–10 μM) and viability was determined by crystal violet staining. Colorimetric quantification results presented as mean ± SEM (n = 5 independent experiments). The fold changes are presented relative to basal values. *p ≤ 0.05 vs the basal values (two-way ANOVA followed by Bonferroni t-test.)
Figure 2
Figure 2
Protective effects of (S S)-DS-ONJ against LPS-mediated iNOS activation and elevation of mRNA levels of pro-inflammatory cytokines in Bv.2 microglial cells. Bv.2 microglial cells were treated for 24 h with LPS (200 ng/mL) or LPS plus (S S)-DS-ONJ (1–10 μM). (A) Colorimetric quantification of nitrites was performed. (B) mRNA of Nos2 was determined by qRT-PCR. (C) Protein extracts were analyzed by Western blot with the corresponding antibodies against iNOS and α-tubulin as loading control. Representative autoradiograms are shown. Blots were quantified by scanning densitometry and the results are presented as mean ± SEM. (D) Tnfa, Il1b, and Il6 mRNA values were determined by qRT-PCR. The results are presented as means ± SEM (n = 6 independent experiments). Fold changes are calculated relative to the basal value. *p ≤ 0.05 vs LPS treatment, p ≤ 0.05 vs basal value (two-way ANOVA followed by Bonferroni t-test.).
Figure 3
Figure 3
Effects of (S S)-DS-ONJ in the activation of MAPKs and NFκB-mediated signaling in LPS-stimulated Bv.2 microglial cells. Bv.2 microglial cells were stimulated with 200 ng/mL LPS in the absence, or presence, of 10 μM (S S)-DS-ONJ for the indicated time periods. (A) Protein extracts were separated by SDS-PAGE, and analyzed by Western blot with antibodies against phosphorylated (p)-JNK, total JNK, phosphorylated (p)-p38α MAPK, total p38α MAPK, IκBα and α-tubulin. Representative autoradiograms are shown (n = 7 independent experiments). Blots were quantified with scanning densitometry, and the results are presented as mean ± SEM. The ratios between the indicated proteins and the fold changes relative to the basal values are shown. *p ≤0.05 vs LPS treatment (two-way ANOVA followed by Bonferroni t-test). (B) Confocal immunofluorescence assessment of the nuclear translocation of p65-NFκB in Bv.2 microglial cells following stimulation with LPS in the presence or absence of (S S)-DS-ONJ. Activation of p65-NFκB nuclear translocation was defined by an increase in immunofluorescence of p65-NFκB (green channel) in the nuclear regions. Nuclear regions of Bv.2 microglial cells were determined by counterstaining nuclear DNA with DAPI (blue channel). White arrows indicate the p65-NFκB nuclear o cytoplasmic localization.
Figure 4
Figure 4
Protective effects of (S S)-DS-ONJ against LPS-mediated inflammasome activation in Bv.2 microglial cells. (A) Nlrp3 mRNA was measured by qRT-PCR. (B) Protein extracts were analyzed by Western blot, with antibodies against NLRP3; α-tubulin was used as loading control. (C) Protein extracts were analyzed by Western blot, with antibodies against caspase-1; α-tubulin was used as loading control. Representative autoradiograms are shown (n = 6 independent experiments). Blots were quantified using scanning densitometry, and the results are presented as means ± SEM. The results are presented as means ± SEM (n = 6 independent experiments). Fold changes are calculated relative to the basal values. *p ≤ 0.05 vs LPS treatment, p ≤ 0.05 vs basal values (two-way ANOVA followed by Bonferroni t-test).
Figure 5
Figure 5
The anti-inflammatory response mediated by HO-1 and IL-10. Bv.2 microglial cells were stimulated with 200 ng/mL LPS in the presence, or absence, of 10 μM (S S)-DS-ONJ for 24 h. (A) Il10 mRNA determined by qRT-PCR. (B) Protein extracts were analyzed by Western blot with antibodies against HO-1 and α-tubulin (loading control). Representative autoradiograms are shown. Blots were quantified using scanning densitometry. (C) Arg1 mRNA determined by qRT-PCR. The results are presented as means ± SEM. (D) Protein extracts were analyzed using Western blot, with antibodies against Arginase-1; α-tubulin was a loading control. Representative autoradiograms are presented. Blots were quantified using scanning densitometry. The results are presented as means ± SEM. Fold changes are relative to the basal values. *p ≤ 0.05 vs LPS treatment, p ≤ 0.05 vs the basal values (two-way ANOVA followed by Bonferroni t-test).
Figure 6
Figure 6
Reactive gliosis is present in BB rats from 6 weeks of age, and treatment with (S S)-DS-ONJ reduced reactive gliosis. (A) Analysis of GFAP and Iba-1 in retinas from BB rats during DR progression. Protein concentrations in retinal extracts were analyzed by Western blot, with α-tubulin used as loading control. Representative autoradiograms are shown. Results are presented as means ± SEM (n = 5 retinas per condition). *p ≤ 0.05 BB vs WT matched at each age. (B) (upper panels) Retinas from 6 weeks old BB and WT rats. (lower panels) Retinal explants from 6 weeks old BB rats were treated for 24 h with (S S)-DS-ONJ (20 μM) or treatment vehicle alone. Immunostaining for GFAP (green) was performed in whole retinas. Representative images are shown (n = 5 retinas per condition).
Figure 7
Figure 7
Schematic representation of the anti-neuro-inflammatory mechanisms triggered by (S S)-DS-ONJ; 1) The pro-inflammatory environment activates NF-κB in microglia cells resulting in the transcription of IL-1β; 2) The diabetic status increases the formation of NLRP3 inflammasome, promotes the cleavage of pro-caspase-1 to its active form and increases IL-1β processing and secretion. The (S S)-DS-ONJ compound could inhibit NF-κB as well as NLRP3; 3) (SS)-DS-ONJ induces the expression of IL-10, HO-1 and arginase-1 driving a switch of microglia polarization towards the M2 stage to counteract inflammation in microglia cells.

References

    1. Xia T, Rizzolo LJ. Effects of diabetic retinopathy on the barrier functions of the retinal pigment epithelium. Vision Res (2017) 139:72–81. 10.1016/j.visres.2017.02.006 - DOI - PubMed
    1. Caspard H, Jabbour S, Hammar N, Fenici P, Sheehan JJ, Kosiborod M. Recent trends in the prevalence of type 2 diabetes and the association with abdominal obesity lead to growing health disparities in the USA: An analysis of the NHANES surveys from 1999 to 2014. Diabetes Obes Metab (2018) 20(3):667–71. 10.1111/dom.13143 - DOI - PMC - PubMed
    1. Antonetti DA, Klein R, Gardner TW. Diabetic retinopathy. New Engl J Med (2012) 366(13):1227–39. 10.1056/NEJMra1005073 - DOI - PubMed
    1. Imai H, Singh RSJ, Fort PE, Gardner TW. Neuroprotection for diabetic retinopathy. Developments Ophthalmol (2009) 44:56–68. 10.1159/000223946 - DOI - PubMed
    1. Keech AC, Mitchell P, Summanen PA, O’Day J, Davis TM, Moffitt MS, et al. . Effect of fenofibrate on the need for laser treatment for diabetic retinopathy (FIELD study): a randomised controlled trial. Lancet (2007) 370(9600):1687–97. 10.1016/S0140-6736(07)61607-9 - DOI - PubMed

Publication types

MeSH terms