. 2021 Mar 18:12:612302.
doi: 10.3389/fpls.2021.612302. eCollection 2021.

Photomorphogenesis in the Picocyanobacterium Cyanobium gracile Includes Increased Phycobilisome Abundance Under Blue Light, Phycobilisome Decoupling Under Near Far-Red Light, and Wavelength-Specific Photoprotective Strategies

Affiliations

Photomorphogenesis in the Picocyanobacterium Cyanobium gracile Includes Increased Phycobilisome Abundance Under Blue Light, Phycobilisome Decoupling Under Near Far-Red Light, and Wavelength-Specific Photoprotective Strategies

Gábor Bernát et al. Front Plant Sci. .

Abstract

Photomorphogenesis is a process by which photosynthetic organisms perceive external light parameters, including light quality (color), and adjust cellular metabolism, growth rates and other parameters, in order to survive in a changing light environment. In this study we comprehensively explored the light color acclimation of Cyanobium gracile, a common cyanobacterium in turbid freshwater shallow lakes, using nine different monochromatic growth lights covering the whole visible spectrum from 435 to 687 nm. According to incident light wavelength, C. gracile cells performed great plasticity in terms of pigment composition, antenna size, and photosystem stoichiometry, to optimize their photosynthetic performance and to redox poise their intersystem electron transport chain. In spite of such compensatory strategies, C. gracile, like other cyanobacteria, uses blue and near far-red light less efficiently than orange or red light, which involves moderate growth rates, reduced cell volumes and lower electron transport rates. Unfavorable light conditions, where neither chlorophyll nor phycobilisomes absorb light sufficiently, are compensated by an enhanced antenna size. Increasing the wavelength of the growth light is accompanied by increasing photosystem II to photosystem I ratios, which involve better light utilization in the red spectral region. This is surprisingly accompanied by a partial excitonic antenna decoupling, which was the highest in the cells grown under 687 nm light. So far, a similar phenomenon is known to be induced only by strong light; here we demonstrate that under certain physiological conditions such decoupling is also possible to be induced by weak light. This suggests that suboptimal photosynthetic performance of the near far-red light grown C. gracile cells is due to a solid redox- and/or signal-imbalance, which leads to the activation of this short-term light acclimation process. Using a variety of photo-biophysical methods, we also demonstrate that under blue wavelengths, excessive light is quenched through orange carotenoid protein mediated non-photochemical quenching, whereas under orange/red wavelengths state transitions are involved in photoprotection.

Keywords: cyanobacteria; imbalance; light-quality acclimation; photosynthesis; pigment composition.


Conflict of interest statement

The authors declare that the research was conducted in the absence of any commercial or financial relationships that could be construed as a potential conflict of interest.

Figures
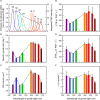
FIGURE 1
FIGURE 1
(A) Emission spectra of the LEDs used for cultivation of C. gracile ACT 1026 (solid lines, left axis). The areas under the individual spectra correspond with photosynthetically usable radiation (PUR; dashed line and numbers on top, right axis) based on the UV-Vis spectra of the C. gracile cells grown under monochromatic lights (as detailed in Figure 2B). Growth rates (B), cellular volumes (C) and ETR parameters (D–F) were determined for C. gracile during semi-continuous cultivation under monochromatic lights as shown in panel (A). ETR (D), ETRmax (E) and α (F) were determined by SP analysis of the corresponding fluorescence induction curves [(D); see also Supplementary Figure 6] and rapid light curves (E,F) using 625 nm ML and AL. (For other ML’s and AL’s, see Supplementary Figure 1.) Values of three biological replicates were averaged; standard errors are indicated as error bars in panels (B–F). Dashed lines in panels (A–F) represent the trend lines.
FIGURE 2
FIGURE 2
(A) Functional absorption cross-section of PSII, σII, as a function of actinic light (AL) wavelength in C. gracile sp. ACT 1026 cells grown under monochromatic lights (as detailed in Figure 1A). Values of three biological replicates were averaged; standard errors are indicated as error bars. (B) Absorbance spectra of C. gracile grown under particular monochromatic lights. Spectra were baseline corrected and normalized to the 680 nm Chl a Q-band. Each spectrum represents the average of three biological replicates; error intervals are not shown for clarity. (C) A625/A680 ratios as a function of growth light. Averaged absorbance spectrum of cultures grown under 615 nm light is shown as a reference. The legends in panel (A,B) indicate the wavelengths of growth lights.
FIGURE 3
FIGURE 3
Pigment contents in C. gracile sp. ACT 1026 cultures grown under monochromatic lights (as detailed in Figure 1A). Total phycobiliprotein content of the cultures (A) was determined based on the absorbance spectra shown in Figure 2B, while the levels of Chl a and carotenoids (B–F) were determined by HPLC. Pigment levels were normalized either to OD750 [(A), total phycobiliprotein; (B), Chl a; (C), total carotenoid] or to the corresponding Chl a concentration [(D), total carotenoid; (E), zeaxanthin; (F), β-carotene]. Phycobiliprotein to Chl a ratios are shown in Supplementary Figure 2. Data are expressed as mean ± standard error (n = 3). Dashed lines in panels (A–F) represent trend lines in both panels.
FIGURE 4
FIGURE 4
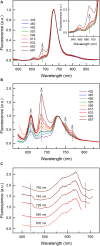
Low temperature (77 K) fluorescence emission and excitation spectra of C. gracile sp. ACT 1026. (A,B) Fluorescence emission spectra of cells grown under monochromatic lights with 455 nm (Chl a) and 590 nm (PBS) excitation, respectively. Three individual spectra of three technical replicates (9 spectra in total for each light condition) were averaged and baseline corrected; error intervals are not shown for clarity. Spectra were normalized to the 685 nm emission. The inset on panel A zooms in the 625 nm – 719 nm spectral region. The gray arrows show the intensification of certain spectral peaks or shoulders with increasing growth wavelengths. (C) Fluorescence excitation spectra of the 687 nm grown cells, with various excitation wavelengths as indicated above each spectrum. Three individual spectra were averaged and reference corrected. Spectra were normalized to the maximal signal intensity and shifted vertically for clarity. Dashed lines represent the wavelengths of Chl a absorption maxima. The narrower spectra with 655, 685, and 728 nm excitation lights are due to the gap between excitation and emission wavelengths.
FIGURE 5
FIGURE 5
Confocal micrographs (A,B) and respective autofluorescence intensity profiles (C,D) of C. gracile sp. ACT 1026 cells grown under 615 nm (A,C) and 687 nm (B,D) light. Multicolor images in panels (A,B) were composed of PBS (green) and Chl a (red) autofluorescence; scale bar is indicated in white. For autofluorescence profiles, fluorescence intensities of 18 (A,C) + 10 (B,D) = 28 cells were normalized to the integrated intensities along the cross-sectional profile and averaged. Data in panels (C,D) are expressed as mean ± standard error; n = 36 (C) and 20 (D), note the central symmetry of the cells. Distances are expressed in pixel units (1 pixel = 90 nm); pixel Nr. 0 indicates the middle of the cells. The difference between PBS autofluorescence profiles is highlighted by green rectangles in panels (C,D).
FIGURE 6
FIGURE 6
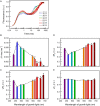
(A) OJIP curves of C. gracile sp. ACT 1026 cells grown under monochromatic lights (as detailed in Figure 1A) and derived parameters as a function of the wavelength of growth light (B–E). (B) Rate of the fluorescence rise during the J-I phase; (C) ψR0, efficiency with which a PSII trapped electron is transferred to final PSI acceptors; (D) δR0, efficiency with which an electron from PQH2 is transferred to final PSI acceptors; (E) ψE0, efficiency with which a PSII trapped electron is transferred from QA to PQ; the parameters were derived according to Stirbet et al. (2018). Curves on panel (A) represent the mean of three biological replicates, normalized to the P level (error intervals are omitted for clarity), while on panels (B–E) standard errors and trendlines are indicated as error bars and dashed lines, respectively. In each case, 625 nm ML and saturating pulse was used. Yet, the traces of parameters in panels (B–E) were independent of the applied measuring light wavelength (for more details, see Supplementary Figure 4).
FIGURE 7
FIGURE 7
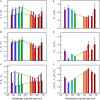
Chl a fluorescence parameters of C. gracile sp. ACT 1026 cells grown under monochromatic lights (as detailed in Figure 1A) as a function of growth light wavelength. (A) Fo (open bars) and Ft (striped bars); (B) Fm (open bars) and Fm′ (striped bars); (C) Fv/Fm (open bars) and Y(II) (striped bars); (D) (Ft – Fo)/Fo; (E) (Fm′ – Fm)/Fm; (F) 1-(FV/Fm – Y(II))/(FV/Fm). In each case, 625 nm ML and AL was used. Values represent the average of three biological replicates; standard errors and trendlines are indicated as error bars and dashed lines, respectively.

References

    1. Ackleson S. G. (2003). Light in shallow waters: a brief research review. Limnol. Oceanogr. 48 323–328. 10.4319/lo.2003.48.1_part_2.0323 - DOI
    1. Acuña A. M., Snellenburg J. J., Gwizdala M., Kirilovsky D., van Grondelle R., van Stokkum I. H. M. (2016). Resolving the contribution of the uncoupled phycobilisomes to cyanobacterial pulse-amplitude modulated (PAM) fluorometry signals. Photosynth. Res. 127 91–102. 10.1007/s11120-015-0141-x - DOI - PMC - PubMed
    1. Bennett A., Bogorad L. (1973). Complementary chromatic adaptation in a filamentous blue-green alga. J. Cell Biol. 58 419–435. 10.1083/jcb.58.2.419 - DOI - PMC - PubMed
    1. Bernát G., Steinbach G., Kaňa R., Govindjee Misra A. N., Prášil O. (2018). On the origin of the slow M–T chlorophyll a fluorescence decline in cyanobacteria: interplay of short-term light-responses. Photosynth. Res. 136 183–198. 10.1007/s11120-017-0458-8 - DOI - PubMed
    1. Bernstein H. C., Konopka A., Melnicki M. R., Hill E. A., Kucek L. A., Zhang S., et al. (2014). Effect of mono- and dichromatic light quality on growth rates and photosynthetic performance of Synechococcus sp. PCC 7002. Front. Microbiol. 5:488. 10.3389/fmicb.2014.00488 - DOI - PMC - PubMed

LinkOut - more resources