Transcriptome Analysis During Follicle Development in Turkey Hens With Low and High Egg Production
- PMID: 33815464
- PMCID: PMC8012691
- DOI: 10.3389/fgene.2021.619196
Transcriptome Analysis During Follicle Development in Turkey Hens With Low and High Egg Production
Abstract
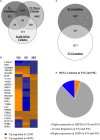
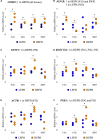
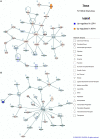
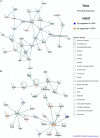
Low and high egg producing hens exhibit gene expression differences related to ovarian steroidogenesis. High egg producing hens display increased expression of genes involved in progesterone and estradiol production, in the granulosa layer of the largest follicle (F1G) and small white follicles (SWF), respectively, whereas low egg producing hens display increased expression of genes related to progesterone and androgen production in the granulosa (F5G) and theca interna layer (F5I) of the fifth largest follicle, respectively. Transcriptome analysis was performed on F1G, F5G, F5I, and SWF samples from low and high egg producing hens to identify novel regulators of ovarian steroidogenesis. In total, 12,221 differentially expressed genes (DEGs) were identified between low and high egg producing hens across the four cell types examined. Pathway analysis implied differential regulation of the hypothalamo-pituitary-thyroid (HPT) axis, particularly thyroid hormone transporters and thyroid hormone receptors, and of estradiol signaling in low and high egg producing hens. The HPT axis showed up-regulation in high egg producing hens in less mature follicles but up-regulation in low egg producing hens in more mature follicles. Estradiol signaling exclusively exhibited up-regulation in high egg producing hens. Treatment of SWF cells from low and high egg producing hens with thyroid hormone in vitro decreased estradiol production in cells from high egg producing hens to the levels seen in cells from low egg producing hens, whereas thyroid hormone treatment did not impact estradiol production in cells from low egg producing hens. Transcriptome analysis of the major cell types involved in steroidogenesis inferred the involvement of the HPT axis and estradiol signaling in the regulation of differential steroid hormone production seen among hens with different egg production levels.
Keywords: HPG axis; HPT axis; RNA-seq; egg production; estradiol; steroidogenesis; thyroid hormone; turkey.
Copyright © 2021 Brady, Liu, Hicks, Long and Porter.
Conflict of interest statement
The authors declare that the research was conducted in the absence of any commercial or financial relationships that could be construed as a potential conflict of interest.
Figures



Similar articles
-
Characterization of hypothalamo-pituitary-thyroid axis gene expression in the hypothalamus, pituitary gland, and ovarian follicles of turkey hens during the preovulatory surge and in hens with low and high egg production.Poult Sci. 2021 Apr;100(4):100928. doi: 10.1016/j.psj.2020.12.026. Epub 2020 Dec 26. Poult Sci. 2021. PMID: 33588341 Free PMC article.
-
Transcriptome analysis of the hypothalamus and pituitary of turkey hens with low and high egg production.BMC Genomics. 2020 Sep 21;21(1):647. doi: 10.1186/s12864-020-07075-y. BMC Genomics. 2020. PMID: 32957911 Free PMC article.
-
Characterization of the hypothalamo-pituitary-gonadal axis in low and high egg producing turkey hens.Poult Sci. 2020 Feb;99(2):1163-1173. doi: 10.1016/j.psj.2019.12.028. Epub 2020 Jan 24. Poult Sci. 2020. PMID: 32029148 Free PMC article.
-
The role of thyroid hormones in regulation of chicken ovarian steroidogenesis.Gen Comp Endocrinol. 2013 Sep 1;190:68-75. doi: 10.1016/j.ygcen.2013.04.012. Epub 2013 Apr 28. Gen Comp Endocrinol. 2013. PMID: 23631902 Review.
-
Interacting Networks of the Hypothalamic-Pituitary-Ovarian Axis Regulate Layer Hens Performance.Genes (Basel). 2023 Jan 4;14(1):141. doi: 10.3390/genes14010141. Genes (Basel). 2023. PMID: 36672882 Free PMC article. Review.
Cited by
-
Morphological Characteristics and Transcriptome Landscapes of Chicken Follicles during Selective Development.Animals (Basel). 2022 Mar 11;12(6):713. doi: 10.3390/ani12060713. Animals (Basel). 2022. PMID: 35327110 Free PMC article.
-
Production performance, egg quality, and uterine gene expression for layers as affected by N-Carbamylglutamate supplementation.Front Vet Sci. 2023 Feb 17;10:1110801. doi: 10.3389/fvets.2023.1110801. eCollection 2023. Front Vet Sci. 2023. PMID: 36876008 Free PMC article.
-
Transcriptomic diversification of granulosa cells during follicular development between White Leghorn and Silky Fowl hens.Front Genet. 2022 Jul 26;13:965414. doi: 10.3389/fgene.2022.965414. eCollection 2022. Front Genet. 2022. PMID: 35957698 Free PMC article.
-
Integrative analysis of the ovarian metabolome and transcriptome of the Yaoshan chicken and its improved hybrids.Front Genet. 2024 Jul 8;15:1416283. doi: 10.3389/fgene.2024.1416283. eCollection 2024. Front Genet. 2024. PMID: 39040995 Free PMC article.
-
Transcriptome comparative analysis of ovarian follicles reveals the key genes and signaling pathways implicated in hen egg production.BMC Genomics. 2021 Dec 15;22(1):899. doi: 10.1186/s12864-021-08213-w. BMC Genomics. 2021. PMID: 34911438 Free PMC article.
References
LinkOut - more resources
Full Text Sources
Other Literature Sources

