. 2021 Apr;10(6):e12080.
doi: 10.1002/jev2.12080. Epub 2021 Apr 1.

Staphylococcus aureus membrane vesicles contain immunostimulatory DNA, RNA and peptidoglycan that activate innate immune receptors and induce autophagy

Affiliations

Staphylococcus aureus membrane vesicles contain immunostimulatory DNA, RNA and peptidoglycan that activate innate immune receptors and induce autophagy

Natalie J Bitto et al. J Extracell Vesicles. 2021 Apr.

Abstract

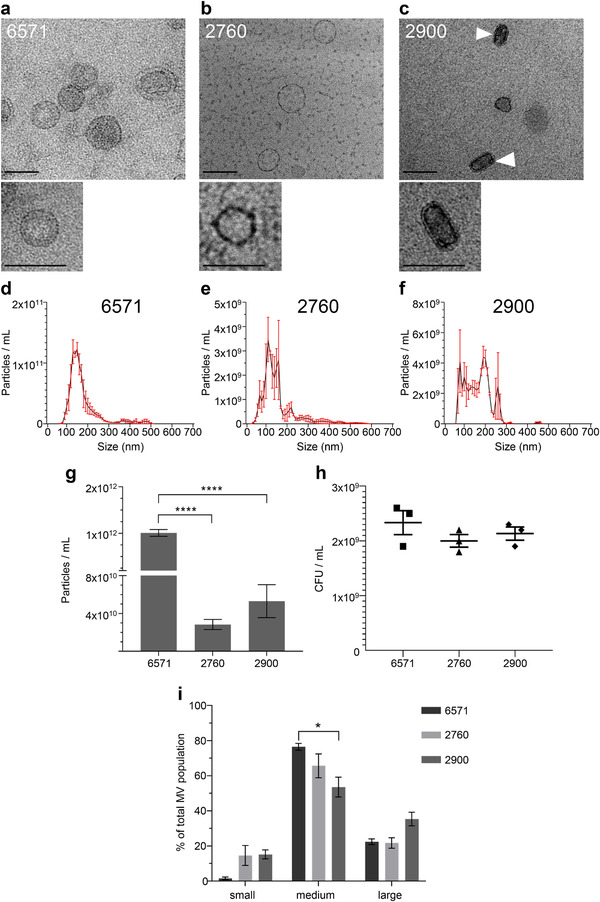
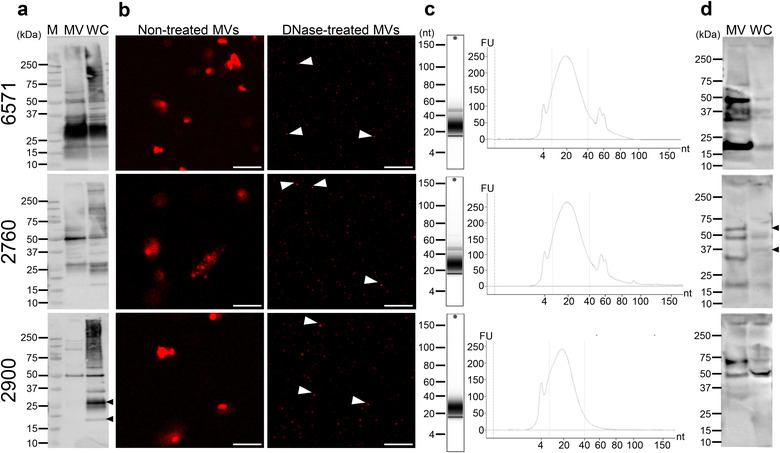
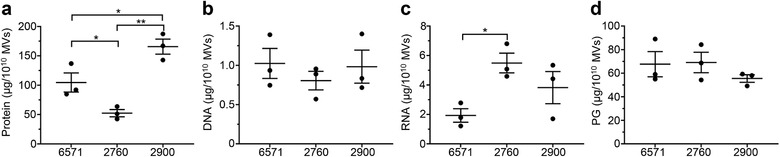
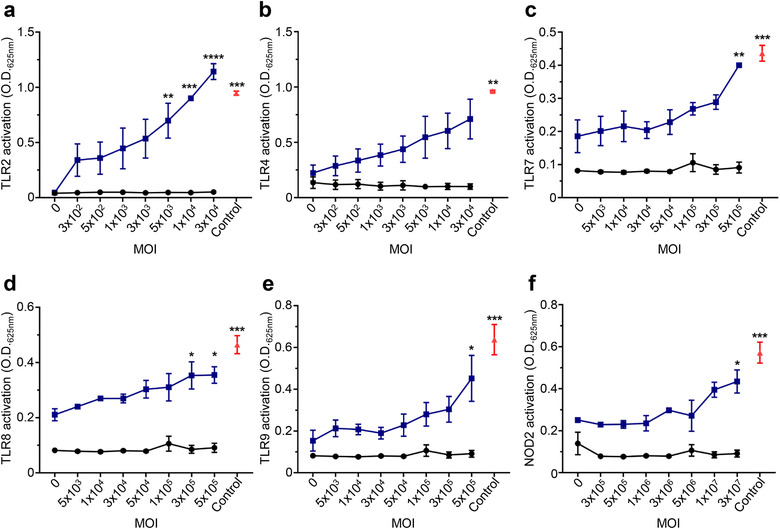
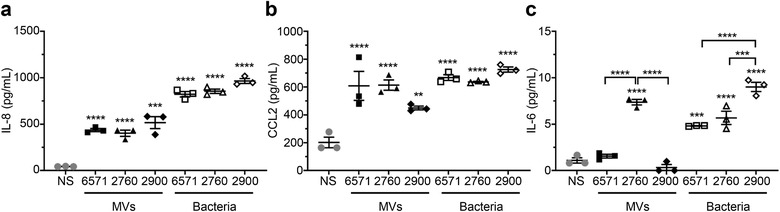
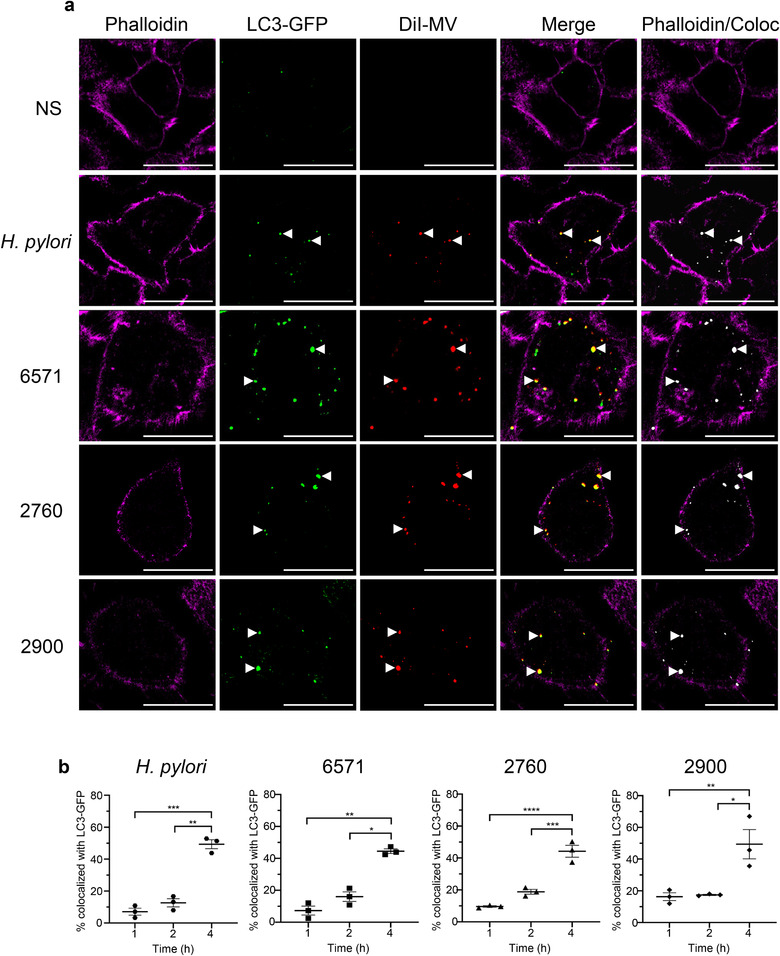
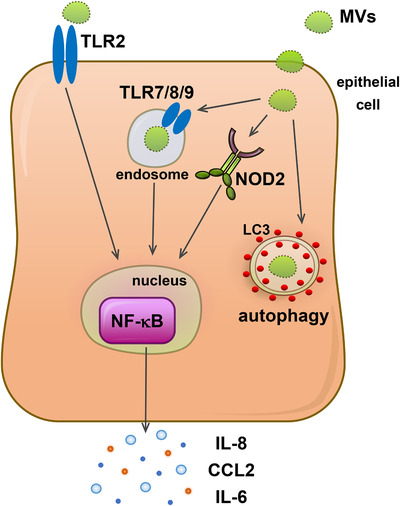
Gram-positive bacteria ubiquitously produce membrane vesicles (MVs), and although they contribute to biological functions, our knowledge regarding their composition and immunogenicity remains limited. Here we examine the morphology, contents and immunostimulatory functions of MVs produced by three Staphylococcus aureus strains; a methicillin resistant clinical isolate, a methicillin sensitive clinical isolate and a laboratory-adapted strain. We observed differences in the number and morphology of MVs produced by each strain and showed that they contain microbe-associated molecular patterns (MAMPs) including protein, nucleic acids and peptidoglycan. Analysis of MV-derived RNA indicated the presence of small RNA (sRNA). Furthermore, we detected variability in the amount and composition of protein, nucleic acid and peptidoglycan cargo carried by MVs from each S. aureus strain. S. aureus MVs activated Toll-like receptor (TLR) 2, 7, 8, 9 and nucleotide-binding oligomerization domain containing protein 2 (NOD2) signalling and promoted cytokine and chemokine release by epithelial cells, thus identifying that MV-associated MAMPs including DNA, RNA and peptidoglycan are detected by pattern recognition receptors (PRRs). Moreover, S. aureus MVs induced the formation of and colocalized with autophagosomes in epithelial cells, while inhibition of lysosomal acidification using bafilomycin A1 resulted in accumulation of autophagosomal puncta that colocalized with MVs, revealing the ability of the host to degrade MVs via autophagy. This study reveals the ability of DNA, RNA and peptidoglycan associated with MVs to activate PRRs in host epithelial cells, and their intracellular degradation via autophagy. These findings advance our understanding of the immunostimulatory roles of Gram-positive bacterial MVs in mediating pathogenesis, and their intracellular fate within the host.

Keywords: DNA; NOD2; RNA; Staphylococcus aureus; TLRs; autophagy; bacterial membrane vesicles; bacterial pathogenesis; innate immunity; peptidoglycan.


Figures

FIGURE 1
FIGURE 1
Membrane vesicles isolated from S. aureus strains 6571, 2760 and 2900 vary in size and quantity. Transmission electron microscopy (TEM) of (a) 6571, (b) 2760 and (c) 2900 MVs (arrows indicate elliptical MVs), showing both wide‐field images and magnified images of single MVs of each strain. TEM images are representative of three biological replicates. Scale bar = 100 nm. Size distribution of MVs isolated from (d) 6571, (e) 2760 and (f) 2900 determined by NanoSight NTA. Data show the mean of three biological replicates (black line) ± SEM (red error bars). (g) Total number of particles per ml produced by each strain as indicated, determined by NanoSight NTA. Data show mean of three biological replicates ± SEM. ****P < 0.0001 (One‐way ANOVA with Tukey's multiple comparisons test). (h) The number of viable bacteria present in individual cultures at the point of MV isolation for each strain. Data show CFU/ml of individual cultures, and the mean ± SEM of three biological replicates. (i) Quantification by NanoSight NTA of the size distribution of small (<100 nm), medium (100‐200 nm) and large (>200 nm) MVs found within heterogenous MV samples produced by S. aureus strains, as indicated. Data are calculated from the average of three biological replicates ± SEM. *P < 0.05 (One‐way ANOVA with Tukey's multiple comparisons test).
FIGURE 2
FIGURE 2
Detection of the protein, DNA, RNA and peptidoglycan cargo of S. aureus MVs. Characterization of MV contents from S. aureus strains 6571, 2760 and 2900, as indicated. (a) Protein content of MVs and their parent bacteria was examined using Western immunoblot. MVs (MV; 10 μg) and whole‐cell bacterial lysate (WC; 10 μg) proteins were detected using anti‐S. aureus polyclonal antibodies. The black arrows highlight differences in the protein content of 2900 WC compared to 2900 MVs. M = Precision Plus Protein standard (Bio‐Rad Laboratories). (b) Confocal microscopy was used to visualize the location and amount of DNA associated with MVs. MVs were treated with or without DNase and stained with the membrane permeable DNA stain SYTO‐61, showing both external DNA (non‐treated MVs) and internal DNA (DNase‐treated MVs) as indicated. Arrows highlight internal DNA remaining after DNase‐treatment. Scale bar = 2 μm. Representative of n = 3 biological replicates. (c) RNA was extracted from 6571, 2760 and 2900 MVs and analyzed using the Agilent Bioanalyzer. Tapestation gel shows RNA profile and graph shows RNA concentration in fluorescent units (FU) vs. nucleotide length (nt). The size range of small RNAs (sRNA) of 10 – 40 nt is indicated by the dotted lines. Representative of n = 3 biological replicates. (d) Detection of MV‐associated peptidoglycan by Western immunoblot. MVs (MV; 10 μg) and whole‐cell bacterial lysate (WC; 10 μg) were separated by SDS‐PAGE and peptidoglycan was detected using an anti‐peptidoglycan antibody. The black arrows highlight differences in the peptidoglycan content of 2760 WC compared to 2760 MVs.
FIGURE 3
FIGURE 3
Quantification of the protein, DNA, RNA and peptidoglycan cargo of S. aureus MVs. Quantification of (a) protein, (b) DNA, (c) RNA and (d) peptidoglycan (PG) associated with MVs from S. aureus strains 6571, 2760 and 2900. Protein, DNA and RNA were quantified by Qubit, while peptidoglycan was quantified colorimetrically based on the concentration of muramic acid present in the MVs. Data shows individual biological MV samples and indicates the mean ± SEM of three biological replicates. *P < 0.05, **P < 0.01 (One‐way ANOVA with Tukey's or Dunnett's multiple comparisons tests).
FIGURE 4
FIGURE 4
DNA, RNA and peptidoglycan associated with S. aureus MVs activate TLR and NOD2 signaling. The ability of 6571 MVs to activate specific PRRs was investigated using HEK‐Blue reporter cell lines expressing (a) TLR2, (b) TLR4, (c) TLR7, (d) TLR8 or (e) TLR9, or (f) NOD2 receptors (blue). Cells were stimulated with an increasing MOI of 6571 MV (x‐axis). Positive controls for each respective cell line (red) include 50 ng/ml Pam3CSK4 (TLR2), 6.25 ng/ml LPS (TLR4) 1 pg/ml R848 (TLR7 and TLR8), 5 nM CpG ODN (TLR9) or 0.001 pg/ml L18‐MDP (NOD2). HEK‐Blue Null cells were used as a negative control (black). Data are represented as mean ± SEM of three biological replicates. Significance was calculated by comparing to the non‐stimulated control of the same cell line. *P < 0.05, **P < 0.01, ***P < 0.001, ****P < 0.0001 (One‐way ANOVA with Dunnett's multiple comparisons test).
FIGURE 5
FIGURE 5
S. aureus MVs induce the production of pro‐inflammatory cytokines and chemokines by lung epithelial cells in a strain dependent manner. The amount of (a) IL‐8, (b) CCL2 and (c) IL‐6 produced by A549 cells in response to stimulation with 1 × 10¹⁰ MVs (MOI = 5 × 10⁴ MVs per cell, black filled shapes) from S. aureus strains 6571, 2760 and 2900, was determined using cytometric bead array (CBA) analysis. Non‐stimulated (NS, grey circles) A549 cells, or cells stimulated with S. aureus bacteria (open shapes) at a multiplicity of infection (MOI) of 100 were used as negative and positive controls, respectively. Data show the mean of three biological replicates ± SEM. **P < 0.01, ***P < 0.001, ****P < 0.0001 compared to the NS control, unless indicated with brackets (One‐way ANOVA with Tukey's multiple comparisons test).
FIGURE 6
FIGURE 6
S. aureus MVs induce the formation of autophagosomes in lung epithelial cells. (a) A549 cells were transfected with LC3‐GFP (green) and stimulated for 4 h with DiI‐labelled 6571, 2760 or 2900 MVs (red), or positive controls DiI‐labelled H. pylori OMVs (red) or 100 ng/ml rapamycin (Rap). Cells were also pre‐treated with 10 nM bafilomycin A1 (BafA1), an inhibitor of phagolysosomal degradation, for 30 min prior to stimulation. Non‐stimulated cells (NS) served as a negative control. Cell nuclei were stained using DAPI (blue). Autophagosome formation is evident by the formation of LC3‐GFP puncta (white arrow heads) and colocalization of MVs with LC3‐GFP puncta is seen in yellow. Images were acquired in 3D and show z projections of the 3D image. Images are representative of three biological replicates. Scale bar = 20 μm. (b) Quantification of LC3‐GFP puncta in cells pre‐treated with or without BafA1 then stimulated for 4 h with MVs from S. aureus 6571 (squares), 2760 (triangles) and 2900 (diamonds) or controls H. pylori OMVs (hexagons), rapamycin (circles) or non‐stimulated cells (grey circles). Data show three biological replicates with average ± SEM. Triplicate images were captured per treatment for each biological replicate, with >50 cells per biological replicate counted. **P < 0.01, ***P < 0.001, ****P < 0.0001 compared to NS control unless indicated with a bracket (One‐way ANOVA with Tukey's multiple comparisons test).
FIGURE 7
FIGURE 7
MVs colocalize with LC3‐GFP puncta. (a) Single confocal plane of A549 cells stained with the cytoskeletal marker phalloidin Alexa Fluor 680 (magenta), showing intracellular LC3‐GFP puncta (green) and DiI‐labelled 6571, 2760 or 2900 MVs (red). Merged images show colocalization of LC3‐GFP puncta and MVs (yellow) within the cell cytoskeleton (magenta). Colocalization of LC3‐GFP with MVs was analyzed using Imaris (Bitplane) and detection of colocalized regions (coloc) is shown in white. Arrow heads indicate colocalized LC3‐GFP puncta with DiI‐labelled MVs or OMVs. Controls include H. pylori OMVs (red) or non‐stimulated cells. Images are representative of three biological replicates. Scale bar = 20 μm. (b) Percentage of colocalization between LC3‐GFP puncta and S. aureus MVs or H. pylori OMVs at 1 h, 2 h and 4 h stimulation. Data show three biological replicates with average ± SEM. Triplicate images were captured per treatment for each biological replicate, with >50 cells per biological replicate counted. *P < 0.05, **P < 0.01, ***P < 0.001, ****P < 0.0001 (One‐way ANOVA with Tukey's multiple comparisons test).
FIGURE 8
FIGURE 8
Model of immune detection, inflammatory signaling and intracellular fate of MVs produced by Gram‐positive bacteria. MVs produced by Gram‐positive bacteria can interact with PRRs expressed on the surface of epithelial cells. Interaction of S. aureus MVs with epithelial cells results in the activation of TLR2 located at the host cell surface. Furthermore, upon entry into host epithelial cells, MV‐associated RNA, DNA and peptidoglycan cargo is detected by the endosomal PRRs TLR7, 8 and 9, and the cytoplasmic receptor NOD2, respectively. Activation of surface and cytoplasmic host PRRs by MV‐associated cargo results in the activation of NF‐κB and the production and release of pro‐inflammatory cytokines and chemokines to facilitate pathogenesis in the host. Furthermore, intracellular detection of MVs leads to their sequestration into autophagosomes and their subsequent degradation via the host cellular degradation pathway of autophagy to enable clearance of MVs from host cells.

References

    1. Andreoni, F. , Toyofuku, M. , Menzi, C. , Kalawong, R. , Mairpady Shambat, S. , François, P. , Zinkernagel, A. S. , & Eberl, L. (2019). Antibiotics stimulate formation of vesicles in Staphylococcus aureus in both phage‐dependent and ‐independent fashions and via different routes. Antimicrobial Agents and Chemotherapy, 63, e01439–01418. - PMC - PubMed
    1. Avila‐Calderón, E. D. , Lopez‐Merino, A. , Jain, N. , Peralta, H. , López‐Villegas, E. O. , Sriranganathan, N. , Boyle, S. M. , Witonsky, S. , & Contreras‐Rodríguez, A. (2012). Characterization of outer membrane vesicles from Brucella melitensis and protection induced in mice. Clinical & Developmental Immunology, 2012, 352493. - PMC - PubMed
    1. Baarda, B. I. , Zielke, R. A. , Le Van, A. , Jerse, A. E. , & Sikora, A. E. (2019). Neisseria gonorrhoeae MlaA influences gonococcal virulence and membrane vesicle production. Plos Pathogens, 15, e1007385. - PMC - PubMed
    1. Bielaszewska, M. , Rüter, C. , Bauwens, A. , Greune, L. , Jarosch, K.‐A. , Steil, D. , Zhang, W. , He, X. , Lloubes, R. , Fruth, A. , Kim, K. S. , Schmidt, M. A. , Dobrindt, U. , Mellmann, A. , & Karch, H. (2017). Host cell interactions of outer membrane vesicle‐associated virulence factors of enterohemorrhagic Escherichia coli O157: Intracellular delivery, trafficking and mechanisms of cell injury. Plos Pathogens, 13, e1006159. - PMC - PubMed
    1. Bielig, H. , Rompikuntal, P. K. , Dongre, M. , Zurek, B. , Lindmark, B. , Ramstedt, M. , Wai, S. N. , & Kufer, T. A. (2011). NOD‐like receptor activation by outer membrane vesicles from Vibrio cholerae non‐O1 non‐O139 strains is modulated by the quorum‐sensing regulator HapR. Infection and Immunity, 79, 1418–1427. - PMC - PubMed

Publication types

LinkOut - more resources