. 2021 Mar 18:11:559623.
doi: 10.3389/fonc.2021.559623. eCollection 2021.

Correlation Between Dual-Time-Point FDG PET and Tumor Microenvironment Immune Types in Non-Small Cell Lung Cancer

Affiliations

Correlation Between Dual-Time-Point FDG PET and Tumor Microenvironment Immune Types in Non-Small Cell Lung Cancer

Jianyuan Zhou et al. Front Oncol. .

Abstract

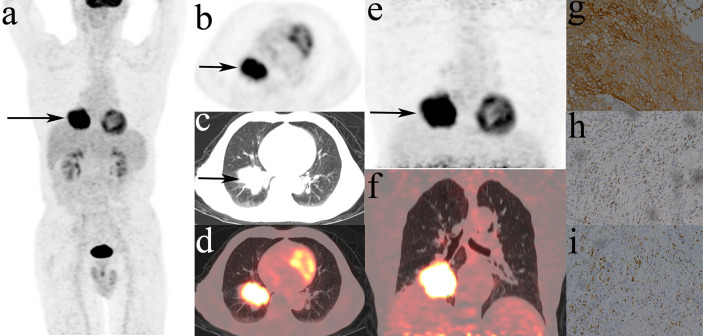
Purpose: Dual-time-point 18F-fluorodeoxyglucose positron emission tomography (DTP 18F-FDG PET), which reflects the dynamics of tumor glucose metabolism, may also provide a novel approach to the characterization of both cancer cells and immune cells within the tumor immune microenvironment (TIME). We investigated the correlations between the metabolic parameters (MPs) of DTP 18F-FDG PET images and the tumor microenvironment immune types (TMITs) in patients with non-small cell lung cancer (NSCLC).

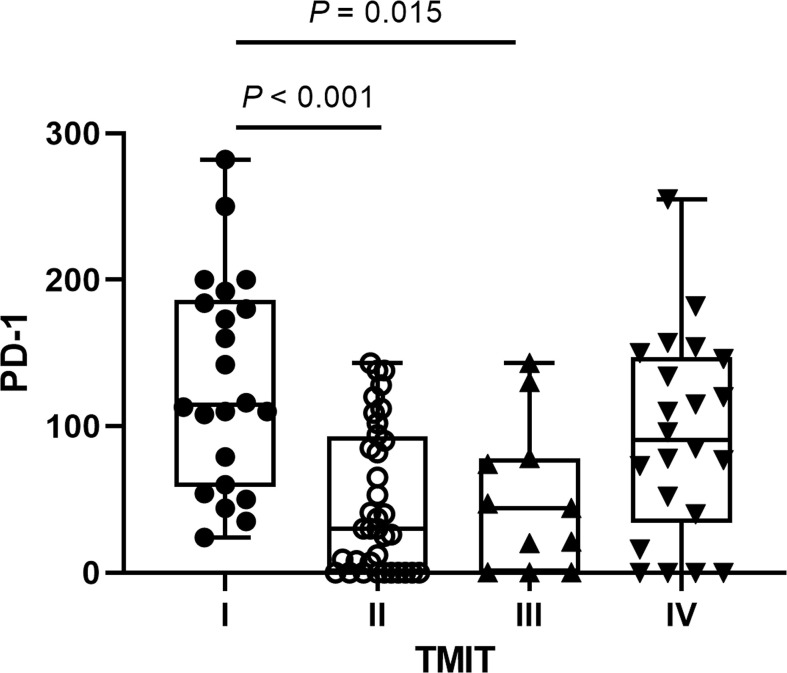
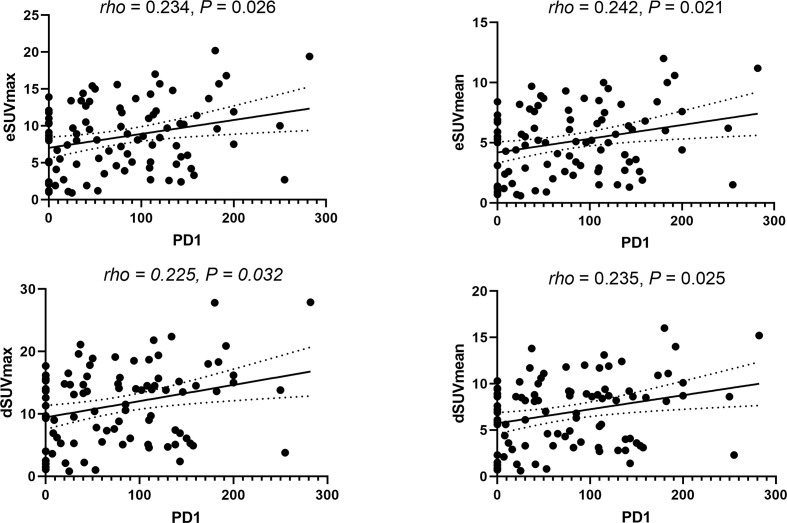
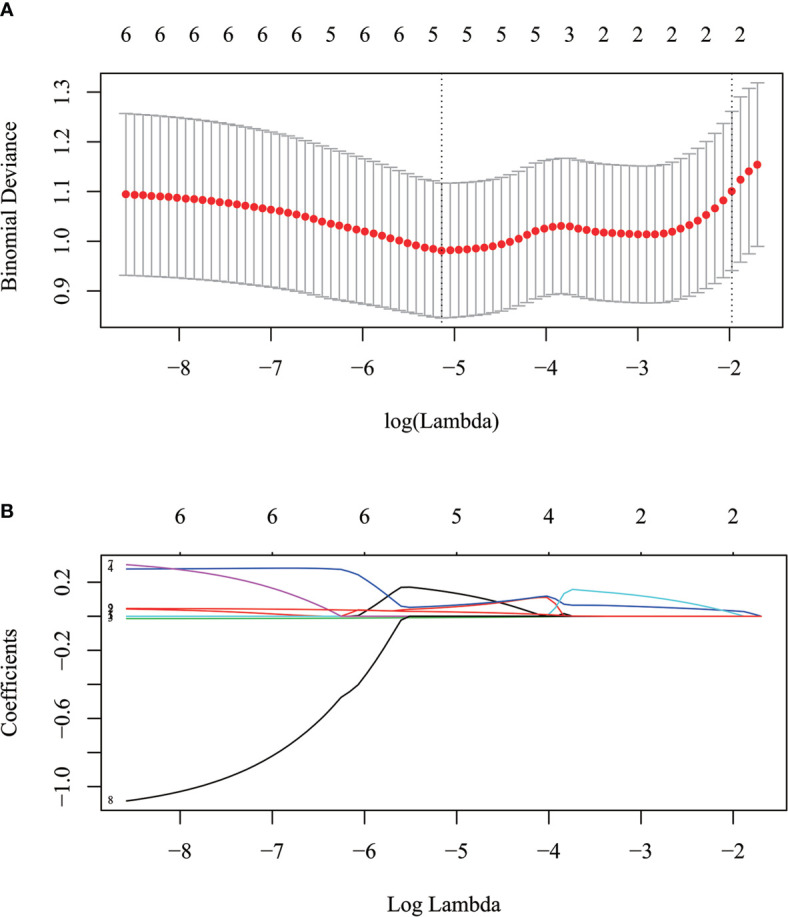
Methods: A retrospective analysis was performed in 91 patients with NSCLC who underwent preoperative DTP 18F-FDG PET/CT scans. MPs in the early scan (eSUVmax, eSUVmean, eMTV, eTLG) and delayed scan (dSUVmax, dSUVmean, dMTV, dTLG) were calculated, respectively. The change in MPs (ΔSUVmax, ΔSUVmean, ΔMTV, ΔTLG) between the two time points were calculated. Tumor specimens were analyzed by immunohistochemistry for PD-1/PD-L1 expression and CD8+ tumor-infiltrating lymphocytes (TILs). TIME was classified into four immune types (TMIT I ~ IV) according to the expression of PD-L1 and CD8+ TILs. Correlations between MPs with TMITs and the immune-related biomarkers were analyzed. A composite metabolic signature (Meta-Sig) and a combined model of Meta-Sig and clinical factors were constructed to predict patients with TMIT I tumors.

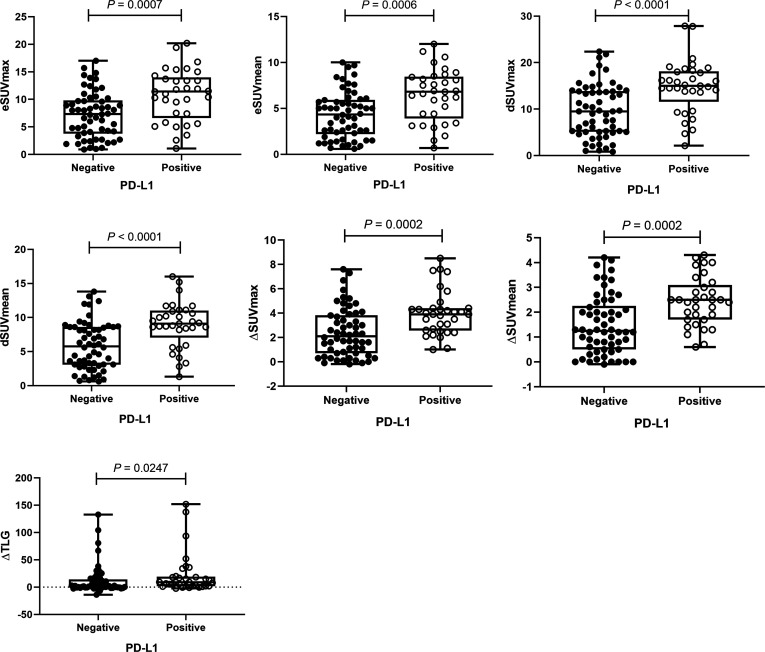
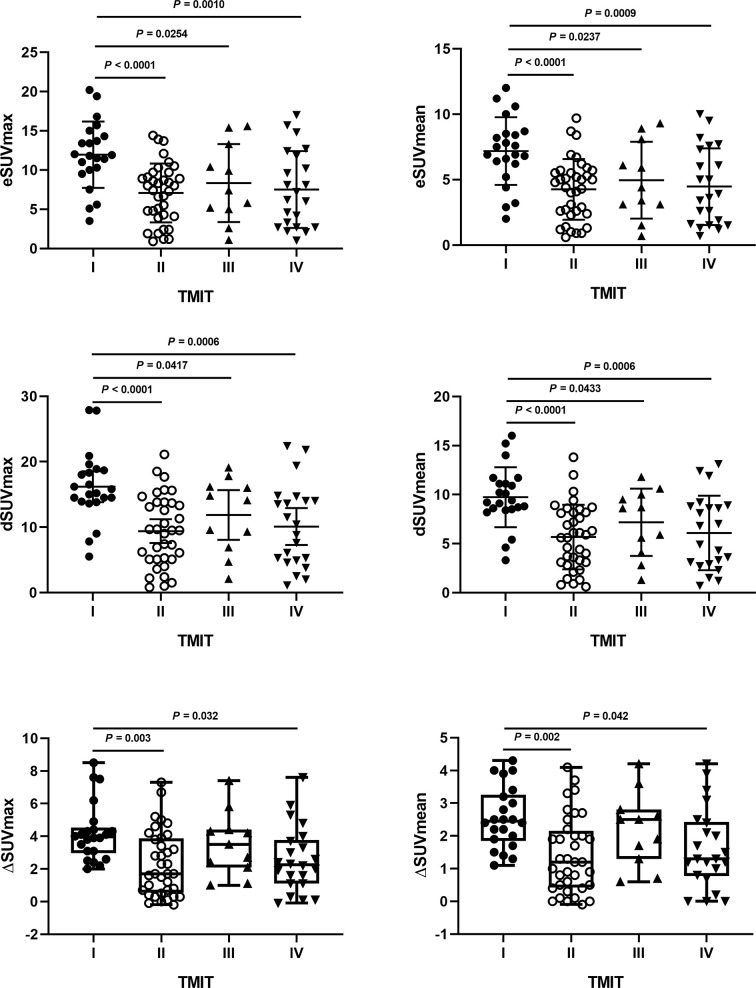
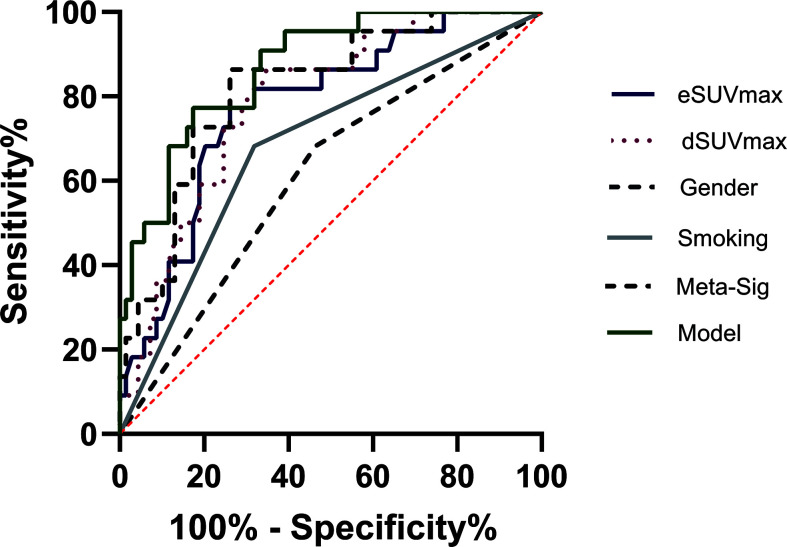
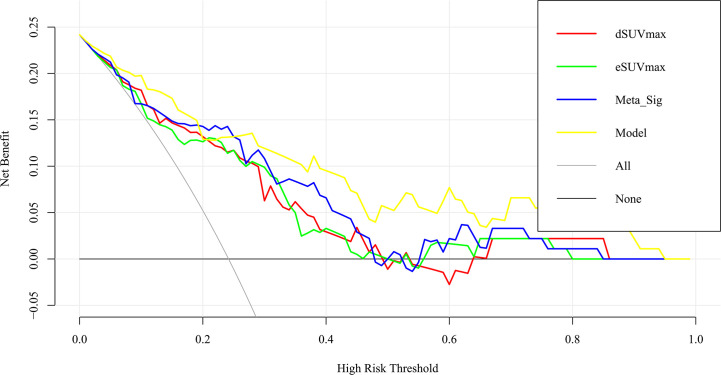
Results: eSUVmax, eSUVmean, dSUVmax, dSUVmean, ΔSUVmax, ΔSUVmean, and ΔTLG were significantly higher in PD-L1 positive patients (p = 0.0007, 0.0006, < 0.0001, < 0.0001, 0.0002, 0.0002, 0.0247, respectively), and in TMIT-I tumors (p = 0.0001, < 0.0001, < 0.0001, < 0.0001, 0.0009, 0.0009, 0.0144, respectively). Compared to stand-alone MP, the Meta-Sig and combined model displayed better performance for assessing TMIT-I tumors (Meta-sig: AUC = 0.818, sensitivity = 86.36%, specificity = 73.91%; Model: AUC = 0.869, sensitivity = 77.27%, specificity = 82.61%).

Conclusion: High glucose metabolism on DTP 18F-FDG PET correlated with the TMIT-I tumors, and the Meta-Sig and combined model based on clinical and metabolic information could improve the performance of identifying the patients who may respond to immunotherapy.

Keywords: DTP 18F-FDG PET; NSCLC; PD-L1; metabolic parameters; tumor microenvironment immune types.


Conflict of interest statement

The authors declare that the research was conducted in the absence of any commercial or financial relationships that could be construed as a potential conflict of interest.

Figures

Figure 1
Figure 1
The distributions of programmed cell death 1 (PD‐1) expression according to different tumor microenvironment immune types (TMITs). The PD-1 expression was significantly higher in TMIT I tumors than TMIT II and III tumors.
Figure 2
Figure 2
The distributions of metabolic parameters (MPs) according to programmed cell death‐ligand 1 (PD‐L1) protein expression. The MPs were significantly higher in patients with PD‐L1 positivity than those with PD‐L1 negativity.
Figure 3
Figure 3
Correlations between metabolic parameters and PD-1 expression.
Figure 4
Figure 4
The differences of metabolic parameters (MPs) according to different tumor microenvironment immune types (TMITs). The MPs were significantly higher in TMIT I tumors than other immune types.
Figure 5
Figure 5
Representative DTP 18F-FDG PET/CT imagings of a 71y male patients, defined as TMIT I tumor. (A–D): early images, (E, F): delayed images, (A): MIP figure, (B–D): PET, lung window, PET/CT fusion image. A mass was in the lower lobe of right lung (arrow) with markedly increased radioactivity, eSUVmax: 20.3, eSUVmean: 12.0, eMTV: 52.9 cm3, eTLG: 634.8 g, dSUVmax: 27.7, dSUVmean: 16.0, dMTV: 49.16 cm3, dTLG: 786.56 g. The surgical pathology: moderately differentiated squamous cell carcinoma. (G) high PD-L1 expression. (H) PD-1 TIL high density. (I) CD8+ TIL high density.
Figure 6
Figure 6
The selection of optimal MPs using the LASSO algorithm. (A) The optimal tuning parameter (Lambda) in the LASSO model was selected using 10-fold cross-validation at the minimum of lambda. (B) LASSO coefficient profiles of the 9 parameters. According to the 10-fold cross-validation in (A), Five parameters with non-zero coefficients were included for metabolic signature construction.
Figure 7
Figure 7
Representative image of receiver operating characteristic (ROC) curves for various factors in the analyses of TMIT I tumors. The combined model had the highest AUC than other factors.
Figure 8
Figure 8
Decision curve analysis for the model and other factors. The y axis measures the net benefit. The x axis shows the threshold probability. The yellow line represents the combined model. The blue line represents the Meta-Sig only. The thin gray line represents the assumption that all patients were with TMIT I tumors. The black line represents the assumption that no patients have a TMIT I tumor.

Similar articles

Cited by

References

    1. Chen W, Zheng R, Baade PD, Zhang S, Zeng H, Bray F, et al. . Cancer statistics in China, 2015. CA Cancer J Clin (2016) 66(2):115–32. 10.3322/caac.21338 - DOI - PubMed
    1. Zhang M, Yang J, Hua W, Li Z, Xu Z, Qian Q. Monitoring checkpoint inhibitors: predictive biomarkers in immunotherapy. Front Med (2019) 13(1):32–44. 10.1007/s11684-018-0678-0 - DOI - PubMed
    1. Lin Z, Gu J, Cui X, Huang L, Li S, Feng J, et al. . Deciphering Microenvironment of NSCLC based on CD8+ TIL Density and PD-1/PD-L1 Expression. J Cancer (2019) 10(1):211–22. 10.7150/jca.26444 - DOI - PMC - PubMed
    1. Teng MW, Ngiow SF, Ribas A, Smyth MJ. Classifying Cancers Based on T-cell Infiltration and PD-L1. Cancer Res (2015) 75(11):2139–45. 10.1158/0008-5472.CAN-15-0255 - DOI - PMC - PubMed
    1. Binnewies M, Roberts EW, Kersten K, Chan V, Fearon DF, Merad M, et al. . Understanding the tumor immune microenvironment (TIME) for effective therapy. Nat Med (2018) 24(5):541–50. 10.1038/s41591-018-0014-x - DOI - PMC - PubMed