Clinical and Prognostic Pan-Cancer Analysis of N6-Methyladenosine Regulators in Two Types of Hematological Malignancies: A Retrospective Study Based on TCGA and GTEx Databases
- PMID: 33816257
- PMCID: PMC8015800
- DOI: 10.3389/fonc.2021.623170
Clinical and Prognostic Pan-Cancer Analysis of N6-Methyladenosine Regulators in Two Types of Hematological Malignancies: A Retrospective Study Based on TCGA and GTEx Databases
Abstract
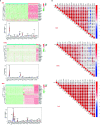
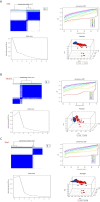
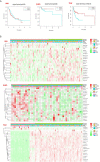
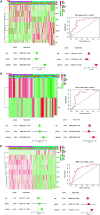
N6-methyladenosine (m6A) is one of the most active modification factors of mRNA, which is closely related to cell proliferation, differentiation, and tumor development. Here, we explored the relationship between the pathogenesis of hematological malignancies and the clinicopathologic parameters. The datasets of hematological malignancies and controls were obtained from the TCGA [AML (n = 200), DLBCL (n = 48)] and GTEx [whole blood (n = 337), blood vascular artery (n = 606)]. We analyzed the m6A factor expression differences in normal tissue and tumor tissue and their correlations, clustered the express obvious clinical tumor subtypes, determined the tumor risk score, established Cox regression model, performed univariate and multivariate analysis on all datasets. We found that the AML patients with high expression of IGF2BP3, ALKBH5, and IGF2BP2 had poor survival, while the DLBCL patients with high expression of METTL14 had poor survival. In addition, "Total" datasets analysis revealed that IGF2BP1, ALKBH5, IGF2BP2, RBM15, METTL3, and ZNF217 were potential oncogenes for hematologic system tumors. Collectively, the expressions of some m6A regulators are closely related to the occurrence and development of hematologic system tumors, and the intervention of specific regulatory factors may lead to a breakthrough in the treatment in the future.
Keywords: hematological malignancies; m6A methylation regulators; pan-cancer analysis; prognosis; risk scores.
Copyright © 2021 Zhang, Zhong, Zou, Liang, Tang, Li, Tan, Huang and Zhu.
Conflict of interest statement
The authors declare that the research was conducted in the absence of any commercial or financial relationships that could be construed as a potential conflict of interest.
Figures


Similar articles
-
m6A RNA methylation regulators play an important role in the prognosis of patients with testicular germ cell tumor.Transl Androl Urol. 2021 Feb;10(2):662-679. doi: 10.21037/tau-20-963. Transl Androl Urol. 2021. PMID: 33718069 Free PMC article.
-
Pan-Cancer Prognostic, Immunity, Stemness, and Anticancer Drug Sensitivity Characterization of N6-Methyladenosine RNA Modification Regulators in Human Cancers.Front Mol Biosci. 2021 Jun 4;8:644620. doi: 10.3389/fmolb.2021.644620. eCollection 2021. Front Mol Biosci. 2021. PMID: 34150845 Free PMC article.
-
Genomic and transcriptomic alterations in m6A regulatory genes are associated with tumorigenesis and poor prognosis in head and neck squamous cell carcinoma.Am J Cancer Res. 2021 Jul 15;11(7):3688-3697. eCollection 2021. Am J Cancer Res. 2021. PMID: 34354868 Free PMC article.
-
Research advances of N6-methyladenosine in diagnosis and therapy of pancreatic cancer.J Clin Lab Anal. 2022 Sep;36(9):e24611. doi: 10.1002/jcla.24611. Epub 2022 Jul 15. J Clin Lab Anal. 2022. PMID: 35837987 Free PMC article. Review.
-
Function of N6-Methyladenosine Modification in Tumors.J Oncol. 2021 Nov 23;2021:6461552. doi: 10.1155/2021/6461552. eCollection 2021. J Oncol. 2021. PMID: 34858499 Free PMC article. Review.
Cited by
-
Expression Profile and Prognostic Significance of Pivotal Regulators for N7-Methylguanosine Methylation in Diffuse Large B-Cell Lymphoma.Mol Biotechnol. 2024 Oct 22. doi: 10.1007/s12033-024-01264-w. Online ahead of print. Mol Biotechnol. 2024. PMID: 39436635
-
The Identification of APOBEC3G as a Potential Prognostic Biomarker in Acute Myeloid Leukemia and a Possible Drug Target for Crotonoside.Molecules. 2022 Sep 7;27(18):5804. doi: 10.3390/molecules27185804. Molecules. 2022. PMID: 36144542 Free PMC article.
-
RNA m6 A methylation in cancer.Mol Oncol. 2023 Feb;17(2):195-229. doi: 10.1002/1878-0261.13326. Epub 2022 Nov 6. Mol Oncol. 2023. PMID: 36260366 Free PMC article. Review.
-
MYC-activated RNA N6-methyladenosine reader IGF2BP3 promotes cell proliferation and metastasis in nasopharyngeal carcinoma.Cell Death Discov. 2022 Feb 8;8(1):53. doi: 10.1038/s41420-022-00844-6. Cell Death Discov. 2022. PMID: 35136045 Free PMC article.
-
The Regulators Associated With N6-Methyladenosine in Lung Adenocarcinoma and Lung Squamous Cell Carcinoma Reveal New Clinical and Prognostic Markers.Front Cell Dev Biol. 2021 Dec 9;9:741521. doi: 10.3389/fcell.2021.741521. eCollection 2021. Front Cell Dev Biol. 2021. PMID: 34957092 Free PMC article.
References
LinkOut - more resources
Full Text Sources
Other Literature Sources

