. 2021 Mar 18:11:607747.
doi: 10.3389/fcimb.2021.607747. eCollection 2021.

Genomic Characterization of Campylobacter jejuni Adapted to the Guinea Pig (Cavia porcellus) Host

Affiliations

Genomic Characterization of Campylobacter jejuni Adapted to the Guinea Pig (Cavia porcellus) Host

Craig T Parker et al. Front Cell Infect Microbiol. .

Abstract

Campylobacter jejuni is the leading bacterial cause of gastroenteritis worldwide with excessive incidence in low-and middle-income countries (LMIC). During a survey for C. jejuni from putative animal hosts in a town in the Peruvian Amazon, we were able to isolate and whole genome sequence two C. jejuni strains from domesticated guinea pigs (Cavia porcellus). The C. jejuni isolated from guinea pigs had a novel multilocus sequence type that shared some alleles with other C. jejuni collected from guinea pigs. Average nucleotide identity and phylogenetic analysis with a collection of C. jejuni subsp. jejuni and C. jejuni subsp. doylei suggest that the guinea pig isolates are distinct. Genomic comparisons demonstrated gene gain and loss that could be associated with guinea pig host specialization related to guinea pig diet, anatomy, and physiology including the deletion of genes involved with selenium metabolism, including genes encoding the selenocysteine insertion machinery and selenocysteine-containing proteins.

Keywords: Campylobacter jejuni; campylobacteriosis; gastroenteritis; selenocysteine; source attribution.


Conflict of interest statement

The authors declare that the research was conducted in the absence of any commercial or financial relationships that could be construed as a potential conflict of interest.

Figures
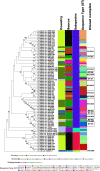
Figure 1
Figure 1
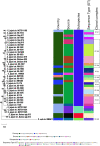
Minimum spanning tree of the MLST results. The concatenated sequences of the 7 MLST alleles (aspA, glnA, gltA, glyA, pgm, tkt, and uncA) from 82 Campylobacter strains were aligned with MAFFT and a dendrogam was created using neighbor-joining algorithm and the Kimura 2-parameter distance correction model. The concatenated profile sequence for the C. coli strain RM5611 (CP007179) was included for comparison. The topology only is shown in the figure. Metadata for isolates including country, isolate source, subspecies and sequence type are color-coded and noted in the key associated with the figure. Clonal complex is also noted in the figure.
Figure 2
Figure 2
Phylogeny of Campylobacters. A) Sixty-two concatenated core genes (concatenated in the order gyrB, pyrG, aspA, atpA, infB, nrdB, lpxB, fabH, glmM, glyA, pgm, nusA, mqnC, clpB, tatC, kdsC, uvrB, glnA, dnaE, dnaK, msbA, dapA, fliP, trmA, folD, aroA, cheR, purH, argF, livM, cmeD, folC, pssA, waaC, dnaX, cfa, ftsY, groEL, pdxA, pnp, hydA, spoT, rodA, mobA, ppk, fumC, katA, fabI, kpsD, flgI, flgK, cadF, addB, putA, acs, nuoB, rplQ, tkt, recA, murB, gltA, secY) within the genomes of 38 genomic sequences were aligned with MAFFT. The dendrogram was constructed using the neighbor-joining algorithm and the Kimura 2-parameter distance correction model. The topology only is shown in the figure. Bootstrap values of ≥50%, generated from 500 replicates, are shown at the nodes. The concatenated profile sequence for the C. coli strain RM5611 (CP007179) was included for comparison. Metadata for isolates including country, isolate source, subspecies and sequence type are color-coded and noted in the key within the figure. Clonal complex is also noted in the figure.
Figure 3
Figure 3
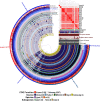
Initial pangenome analysis of Campylobacter strains isolated from various Peruvian sources and other previously characterized strains using Anvi’o software. Sample information includes the average nucleotide identity (ANI) for the 38 Campylobacter strains using percent identity for the intensity of each square with a >95% cutoff. Subspecies, species and source of isolation for each of the Campylobacter strains is included with the color key presented in the legend at the bottom of the figure, additionally the 38 strain layers or rings are colored corresponding to the source of isolation with the exception of the C. coli str. RM5611 (CP007179) (colored based on species) and the three C. jejuni subsp. doylei strains (colored based on subspecies). Sample information also includes for each individual strain the number of gene clusters, number of singleton gene clusters, total number of genes, and total length. The 38 inner rings represent the 38 Campylobacter strains and the presence/absence of a particular gene cluster with the dark colored bar representing the gene cluster is present versus the light-colored bar representing the gene cluster is absent from the strain. Dendrogram at the top of the figure organizes the 38 strain rings based on the frequency of 3,395 gene clusters determined in the pangenome analysis, whereas the inner dendrogram represents the relationship of the strains based on the presence/absence of the gene clusters. Each of the 3,395 gene clusters is binned into one of three following categories: (1) core genes (1,354 gene clusters; present in >95% of genomes); (2) accessory genes (1,344 gene clusters; present in 2 < genomes > 35); (3) singleton genes (697 gene cluster; present in only a single genome). The layer or ring immediately after the 38 Campylobacter strain layers represents the number of genomes contributing to each of the gene cluster bars in the 38 strain layers (ranging from 1 to 38 genomes). The next layer up signifies the number of genes in each of the gene clusters that the bars in the 38 strain layers represents, and the next two layers above is the maximum number of paralogs for each of the gene clusters and single copy gene clusters, respectively. The next three layers represent the homogeneity of the gene clusters including the functional homogeneity, geometric homogeneity and the combined homogeneity, respectively. The final outer layer displays if the cluster of orthologous groups (COG) function for the gene cluster is known or not, red representing a known function and white an unknown function. The figure and all described analysis was conducted using Anvi’o software (v6.2).
Figure 4
Figure 4
Comparative genomics of Peruvian Campylobacter jejuni strains against each other and other Campylobacter strains. Core genome phylogeny and single nucleotide polymorphism (SNP) alignments of 38 Campylobacter strains using the Harvest software suite. C. jejuni str. Guineapig012 was used as the reference strain for analysis. Different characteristics of each of the 38 strains including sequence type (ST) and clonal complex (CC) based on 7 gene multilocus sequence typing (MLST), and the core genome MLST (cgMLST) both using PubMLST database (https://pubmlst.org/) for analysis are shown as follows. Color legend for each section is in the legend in the figure. Intensity mapping of amount of four Campylobacter jejuni integrative elements (CJIEs) present in each of the Campylobacter genomes. Percentage of each CJIE present in genome based on nucleotide BLAST (blastn) search against the four full CJIEs present in Cjj str. RM1221 using Geneious PRIME software. Visualized comparison of all the core and accessory genes for each of the Campylobacter genomes against each other using Roary software.
Figure 5
Figure 5
Deletion of selenium utilization and formate dehydrogenase genes. (A) Schematic representation demonstrating the deletion of selAB from the genomic region adjacent katA within the guinea pig isolate and this same region from the genome of Cjj strain 14980A that possesses selAB. (B) Schematic representation demonstrating the deletion of three gene clusters: 1) fdhTU, 2) selDyefD, and 3) fdhDCBA and fdhM in a genomic region between purA and nspC within the guinea pig isolate and this same region in Cjj strain 14980A.

References

    1. Atterby C., Mourkas E., Meric G., Pascoe B., Wang H., Waldenstrom J., et al. . (2018). The Potential of Isolation Source to Predict Colonization in Avian Hosts: A Case Study in Campylobacter jejuni Strains From Three Bird Species. Front. Microbiol. 9, 591. 10.3389/fmicb.2018.00591 - DOI - PMC - PubMed
    1. Bankevich A., Nurk S., Antipov D., Gurevich A. A., Dvorkin M., Kulikov A. S., et al. . (2012). SPAdes: a new genome assembly algorithm and its applications to single-cell sequencing. J. Comput. Biol. 19, 455–477. 10.1089/cmb.2012.0021 - DOI - PMC - PubMed
    1. Brynildsrud O., Bohlin J., Scheffer L., Eldholm V. (2016). Rapid scoring of genes in microbial pan-genome-wide association studies with Scoary. Genome Biol. 17, 238. 10.1186/s13059-016-1108-8 - DOI - PMC - PubMed
    1. Burakoff A., Brown K., Knutsen J., Hopewell C., Rowe S., Bennett C., et al. . (2018). Outbreak of Fluoroquinolone-Resistant Campylobacter jejuni Infections Associated with Raw Milk Consumption from a Herdshare Dairy - Colorado, 2016. MMWR Morb. Mortal. Wkly. Rep. 67, 146–148. 10.15585/mmwr.mm6705a2 - DOI - PMC - PubMed
    1. Centers for Disease C, Prevention (2013). Incidence and trends of infection with pathogens transmitted commonly through food - foodborne diseases active surveillance network, 10 U.S. sites, 1996-2012. MMWR Morb. Mortal. Wkly. Rep. 62, 283–287. - PMC - PubMed

Publication types