. 2021 Mar 19:9:631063.
doi: 10.3389/fcell.2021.631063. eCollection 2021.

Different Effects of Intramedullary Injection of Mesenchymal Stem Cells During the Acute vs. Chronic Inflammatory Phase on Bone Healing in the Murine Continuous Polyethylene Particle Infusion Model

Affiliations

Different Effects of Intramedullary Injection of Mesenchymal Stem Cells During the Acute vs. Chronic Inflammatory Phase on Bone Healing in the Murine Continuous Polyethylene Particle Infusion Model

Takeshi Utsunomiya et al. Front Cell Dev Biol. .

Abstract

Chronic inflammation is a common feature in many diseases of different organ systems, including bone. However, there are few interventions to mitigate chronic inflammation and preserve host tissue. Previous in vitro studies demonstrated that preconditioning of mesenchymal stem cells (pMSCs) using lipopolysaccharide and tumor necrosis factor-α polarized macrophages from a pro-inflammatory to an anti-inflammatory phenotype and increased osteogenesis compared to unaltered MSCs. In the current study, we investigated the local injection of MSCs or pMSCs during the acute versus chronic inflammatory phase in a murine model of inflammation of bone: the continuous femoral intramedullary polyethylene particle infusion model. Chronic inflammation due to contaminated polyethylene particles decreased bone mineral density and increased osteoclast-like cells positively stained with leukocyte tartrate resistant acid phosphatase (TRAP) staining, and resulted in a sustained M1 pro-inflammatory macrophage phenotype and a decreased M2 anti-inflammatory phenotype. Local injection of MSCs or pMSCs during the chronic inflammatory phase reversed these findings. Conversely, immediate local injection of pMSCs during the acute inflammatory phase impaired bone healing, probably by mitigating the mandatory acute inflammatory reaction. These results suggest that the timing of interventions to facilitate bone healing by modulating inflammation is critical to the outcome. Interventions to facilitate bone healing by modulating acute inflammation should be prudently applied, as this phase of bone healing is temporally sensitive. Alternatively, local injection of MSCs or pMSCs during the chronic inflammatory phase may be a potential intervention to mitigate the adverse effects of contaminated particles on bone.

Keywords: bone healing; inflammation; macrophage; mesenchymal stem cell; osteolysis.


Conflict of interest statement

The authors declare that the research was conducted in the absence of any commercial or financial relationships that could be construed as a potential conflict of interest.

Figures

FIGURE 1
FIGURE 1
Implants, animal model, treatment groups, and timeline. (A) Implants used in this murine model include a mini-osmotic pump containing contaminated polyethylene particles (cPE) with 10 ng/mL of lipopolysaccharide (LPS) or carrier, 6 cm of vinyl catheter and hollow titanium rod (6 mm long, 23 gauge). (B) Schematic drawing of this murine model with a mini-osmotic pump containing cPE or carrier. The mini-osmotic pump with cPE or carrier alone is implanted in the subcutaneous tissue at the dorsum of the mouse (①). The pump is then connected via a subcutaneous vinyl catheter (②) to a hollow titanium rod (③) that is press fit into the intramedullary canal of the right distal femur (④). (C) Groups and timeline. There were ten groups with/without cPE and with/without injection of 5 × 10⁵ mesenchymal stem cells (MSCs) or preconditioned MSCs (pMSCs) into the intramedullary space of the femur through a hollow titanium rod by a Hamilton syringe at the time of primary surgery (time 0) or 3 weeks after primary surgery as follows: (1) cPE (−) control, (2) cPE (+) treatment, (3) cPE (−) MSCs (time 0), (4) cPE (−) pMSCs (time 0), (5) cPE (+) MSCs (time 0), (6) cPE (+) pMSCs (time 0), (7) cPE (−) MSCs (3 weeks), (8) cPE (−) pMSCs (3 weeks), (9) cPE (+) MSCs (3 weeks), and (10) cPE (+) pMSCs (3 weeks). Each group included 7 mice. Pumps were also replaced with new ones containing the same infusion as the first 3 weeks for the following three weeks in every group. Immunohistochemistry, histopathological analysis and MicroCT analysis were carried out 6 weeks after primary surgery. The carrier for the particles was 10%BSA/PBS; cPE, Contaminated polyethylene particles with lipopolysaccharide.
FIGURE 2
FIGURE 2
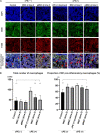
Immunohistochemistry for M1 pro-inflammatory macrophages after cell injection at the primary surgery. Representative photomicrographs of immunohistochemistry for M1 pro-inflammatory macrophages (A) and quantitative data (B) after cell injection at the primary surgery are shown. The M1 pro-inflammatory macrophages (red arrow) were identified by double positively immunofluorescence staining with both anti-F4/80 antibody (red) and anti-inducible nitric oxide synthase (iNOS) antibody (green) (A). Nuclei were visualized with DAPI (blue). The proportion of M1 pro-inflammatory macrophages was quantified according to the following calculation: the number of cells double positively stained with both F4/80 and iNOS divided by the sum of the number of cells stained with F4/80 and the number of cells double positively stained with both F4/80 and iNOS. Scale bar: 50 μm, *p < 0.05 and ***p < 0.0001.
FIGURE 3
FIGURE 3
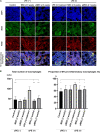
Immunohistochemistry for M1 pro-inflammatory macrophages after cell injection at the pump changing surgery 3 weeks after the primary surgery. Representative photomicrographs of immunohistochemistry for M1 pro-inflammatory macrophages (A) and quantitative data (B) after cell injection at the pump changing surgery 3 weeks after the primary surgery are shown. The M1 pro-inflammatory macrophages (red arrow) were identified by double positively immunofluorescence staining with both anti-F4/80 antibody (red) and anti-inducible nitric oxide synthase (iNOS) antibody (green). Nuclei were visualized with DAPI (blue). The proportion of M1 pro-inflammatory macrophages was quantified according to the following calculation: the number of cells double positively stained with both F4/80 and iNOS divided by the sum of the number of cells stained with F4/80 and the number of cells double positively stained with both F4/80 and iNOS. Scale bar: 50 μm, *p < 0.05 and ***p < 0.0001.
FIGURE 4
FIGURE 4
Immunohistochemistry for M2 anti-inflammatory macrophages after cell injection at the primary surgery. Representative photomicrographs of immunohistochemistry for M2 anti-inflammatory macrophages (A) and quantitative data (B) after cell injection at the primary surgery are shown. The M2 anti-inflammatory macrophages (red arrow) were identified by double positively immunofluorescence staining with both anti-F4/80 antibody (red) and anti-liver Arginase (Arg1) polyclonal antibody (green) (A). Nuclei were visualized with DAPI (blue). The proportion of M2 anti-inflammatory macrophages was quantified according to the following calculation: the number cells double positively stained with both F4/80 and Arg1 divided by the sum of the number of cells positively stained with F4/80 and the number of cells double positively stained with both F4/80 and Arg1. Scale bar: 50 μm, ***p < 0.0001.
FIGURE 5
FIGURE 5
Immunohistochemistry for M2 anti-inflammatory macrophages after cell injection at the pump changing surgery 3 weeks after the primary surgery. Representative photomicrographs of immunohistochemistry for M2 anti-inflammatory macrophages (A) and quantitative data (B) after cell injection at the pump changing surgery 3 weeks after the primary surgery. The M2 anti-inflammatory macrophages (red arrow) were identified by double positively immunofluorescence staining with both anti-F4/80 antibody (red) and anti-liver Arginase (Arg1) polyclonal antibody (green) (A). Nuclei were visualized with DAPI (blue). The proportion of M2 anti-inflammatory macrophages was quantified according to the following calculation: the number cells double positively stained with both F4/80 and Arg1 divided by the sum of the number of cells positively stained with F4/80 and the number of cells double positively stained with both F4/80 and Arg1. Scale bar: 50 μm, ***p < 0.0001.
FIGURE 6
FIGURE 6
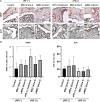
TRAP staining and ALP staining after cell injection at the primary surgery. Representative photomicrographs of leukocyte tartrate resistant acid phosphatase (TRAP) and alkaline phosphatase (ALP) staining (A) and quantitative data (B) after cell injection at the primary surgery are shown. Osteoclast-like cells with multi-nuclei, which were located on the bone perimeter within resorption lacunae were stained brown (red arrow) using TRAP staining in the upper photomicrographs (A). Using 3 randomly selected views with ×200 magnification in each specimen, in a blind manner, two investigators manually counted the number of TRAP staining positive cells, which were finally normalized by the bone area measured using ImageJ software. ALP staining for osteoblast-like cells show as brown-stained cells (yellow arrowhead) in the lower photomicrographs (A). Using the entire image of each specimen with ×100 magnification, the percentage of brown, positively stained area for ALP was quantified based on the entire area of each section measured using ImageJ software. The color threshold of each parameter was determined by consensus of three of the investigators Scale bar: 50 μm, *p < 0.05.
FIGURE 7
FIGURE 7
TRAP staining and ALP staining after cell injection at the pump changing surgery 3 weeks after the primary surgery. Representative photomicrographs of TRAP and ALP staining (A) and quantitative data (B) after cell injection at the pump changing surgery 3 weeks after the primary surgery are shown. Osteoclast-like cells with multi-nuclei, which were located on the bone perimeter within resorption lacunae were stained brown (red arrow) using TRAP staining in the upper photomicrographs (A). Using 3 randomly selected views with ×200 magnification in each specimen, in a blind manner, two investigators manually counted the number of TRAP staining positive cells, which were finally normalized by the bone area measured using ImageJ software. ALP staining for osteoblast-like cells show as brown-stained cells (yellow arrowhead) in the lower photomicrographs (A). Using the entire image of each specimen with ×100 magnification, the percentage of brown, positively stained area for ALP was quantified based on the entire area of each section measured using ImageJ software. The color threshold of each parameter was determined by consensus of three of the investigators Scale bar: 50 μm, *p < 0.05, **p < 0.001, and ***p < 0.0001 compared to the corresponding treatment group with cPE.
FIGURE 8
FIGURE 8
Contaminated polyethylene particles decreased bone mineral density; injection of pMSCs at the primary surgery further decreased bone mineral density. MicroCT was performed 6 weeks after primary surgery. The 3D region of interest (yellow box) was defined as 4 mm × 4 mm × 3 mm within the distal femur and began 3 mm from the distal end of the femur and proceeded proximally (A). Quantitative assessments of bone mineral density are shown in each timing of cell injection at the primary surgery (time 0) and at the pump changing surgery 3 weeks after the primary surgery (B,C). *p < 0.05, **p < 0.001.
FIGURE 9
FIGURE 9
Immunomodulation of bone healing during the early and chronic inflammatory phase. The ideal timeline of inflammation for bone healing consists of an initial and optimal transient stage of acute inflammation followed by the resolution of inflammation, as shown by the blue dotted line in (A) and the blue line in (B). MSC-based therapy during the chronic inflammatory phase may be a potential intervention to mitigate the adverse effects of chronic inflammation of bone. However, MSC-based therapy during the acute inflammatory phase could mitigate the mandatory acute inflammatory reaction, leading to suppression of bone healing.

Similar articles

Cited by

References

    1. Aktas E., Chamberlain C. S., Seather E. E., Duenwald-Kuehi S. E., Kondratko-Mittnacht J., Stitgen M., et al. (2017). Immune modulation with primed mesenchymal stem cells delivered via biodegradable scaffold to repair an Achilles tendon segmental defect. J. Orthop. Res. 35 269–280. 10.1002/stem.1040 - DOI - PubMed
    1. Brooks P. J., Glogauer M., McCulloch C. A. (2019). An overview of the derivation and function of multinucleated giant cells and their role in pathologic processes. Am. J. Pathol. 189 1145–1158. 10.1016/j.ajpath.2019.02.006 - DOI - PubMed
    1. Dominici M., Le Blanc K., Mueller I., Slaper-Cortenbach I., Marini F., Krause D., et al. (2006). Minimal criteria for defining multipotent mesenchymal stromal cells. The International society for cellular therapy position statement. Cytotherapy 8 315–317. 10.1080/14653240600855905 - DOI - PubMed
    1. Gibon E., Ma T., Ren P. G., Fritton K., Biswal S., Yao Z., et al. (2012a). Selective inhibition of the MCP-1-CCR2 ligand-receptor axis decreases systemic trafficking of macrophages in the presence of UHMWPE particles. J. Orthop. Res. 30 547–553. 10.1002/jor.21548 - DOI - PMC - PubMed
    1. Gibon E., Yao Z., Rao A. J., Zwingenberger S., Batke B., Valladares R., et al. (2012b). Effect of a CCR1 receptor antagonist on systemic trafficking of MSCs and polyethylene particle-associated bone loss. Biomaterials 33 3632–3638. 10.1016/j.biomaterials.2012.02.003 - DOI - PMC - PubMed

LinkOut - more resources