

Screening of Hub Genes Associated with Pulmonary Arterial Hypertension by Integrated Bioinformatic Analysis
- PMID: 33816621
- PMCID: PMC8010527
- DOI: 10.1155/2021/6626094
Screening of Hub Genes Associated with Pulmonary Arterial Hypertension by Integrated Bioinformatic Analysis
Abstract
Background: Pulmonary arterial hypertension (PAH) is a disease or pathophysiological syndrome which has a low survival rate with abnormally elevated pulmonary artery pressure caused by known or unknown reasons. In addition, the pathogenesis of PAH is not fully understood. Therefore, it has become an urgent matter to search for clinical molecular markers of PAH, study the pathogenesis of PAH, and contribute to the development of new science-based PAH diagnosis and targeted treatment methods.
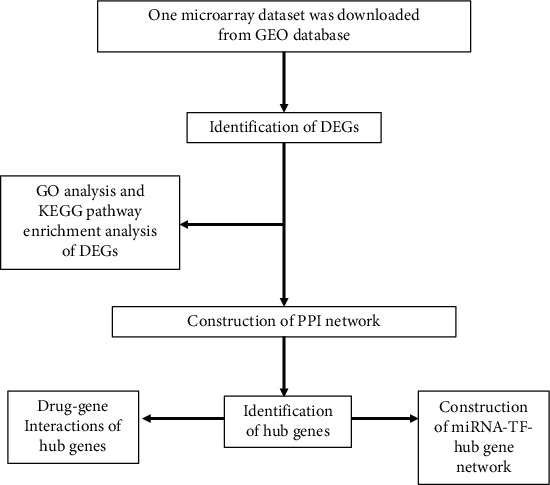
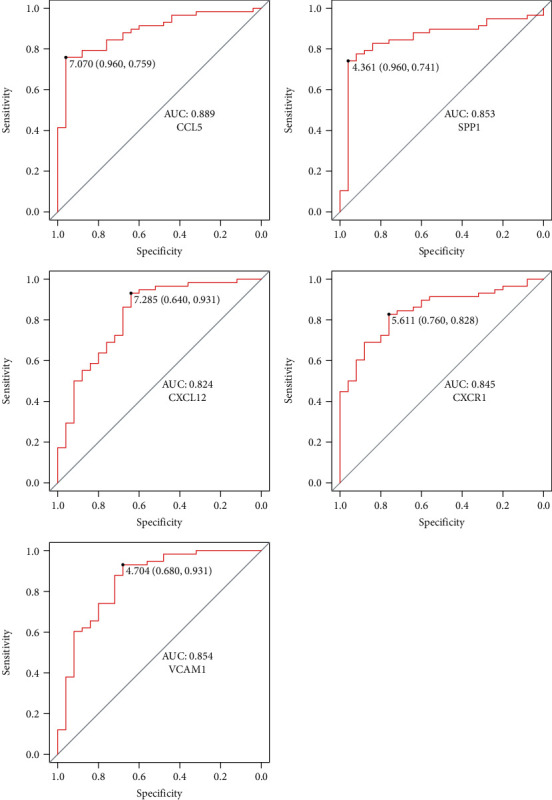
Methods: In this study, the Gene Expression Omnibus (GEO) database was used to downloaded a microarray dataset about PAH, and the differentially expressed genes (DEGs) between PAH and normal control were screened out. Moreover, we performed the functional enrichment analyses and protein-protein interaction (PPI) network analyses of the DEGs. In addition, the prediction of miRNA and transcriptional factor (TF) of hub genes and construction miRNA-TF-hub gene network were performed. Besides, the ROC curve was used to evaluate the diagnostic value of hub genes. Finally, the potential drug targets for the 5 identified hub genes were screened out.
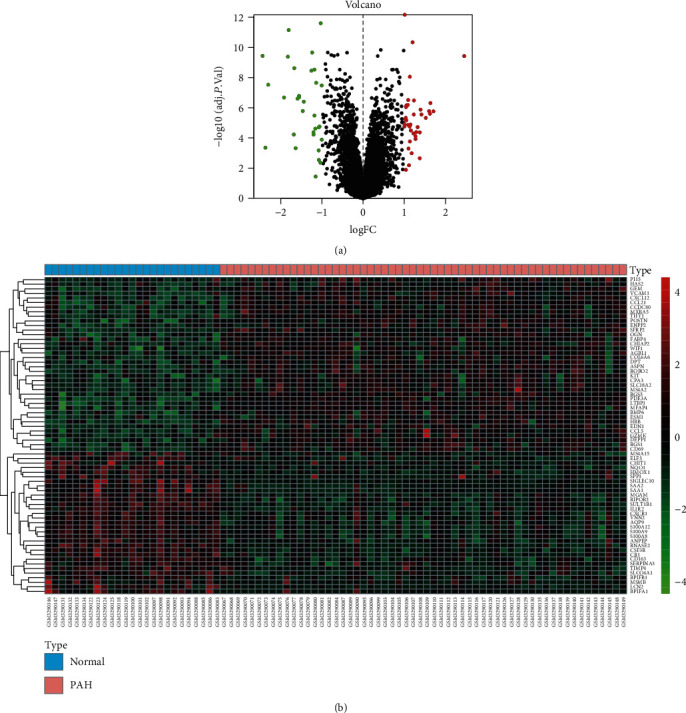
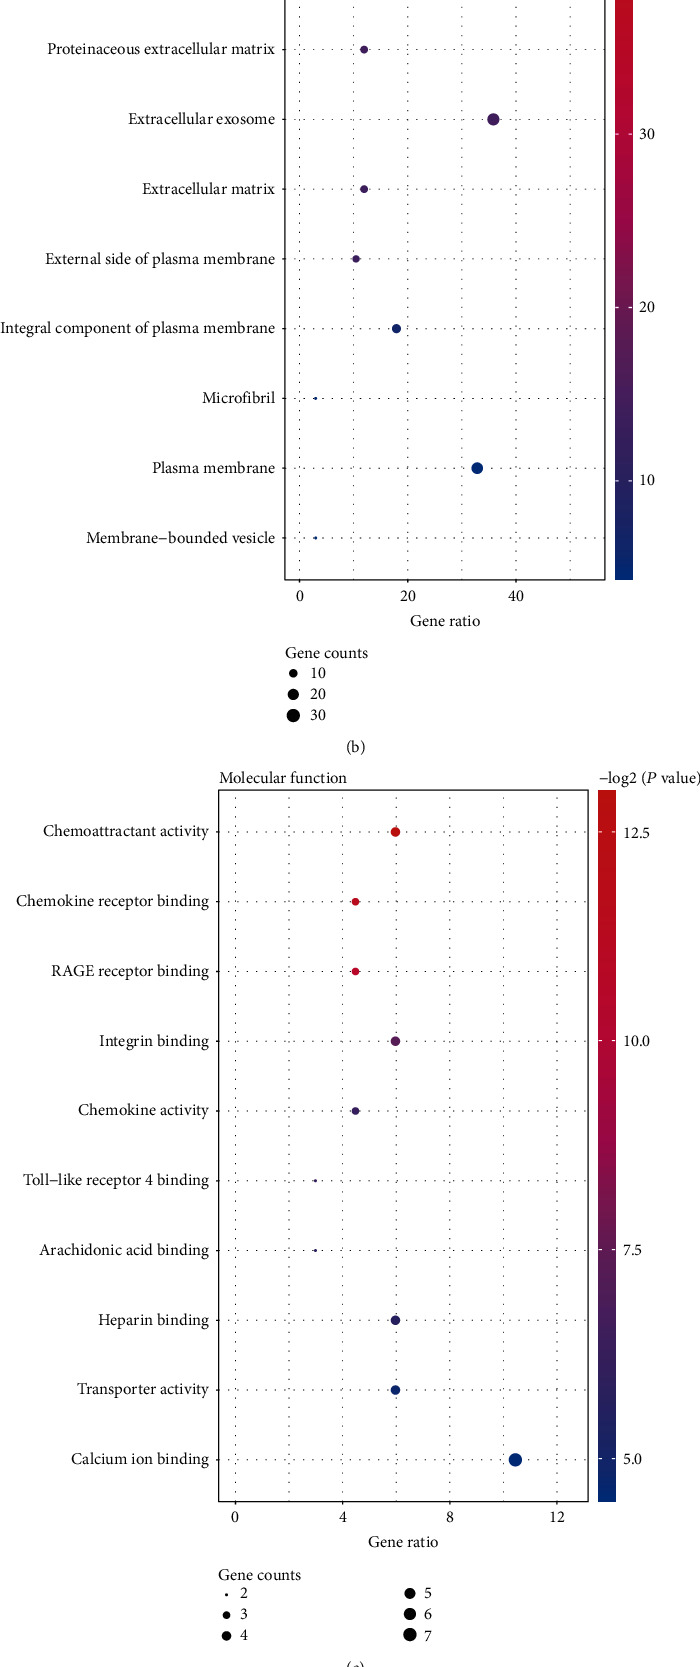
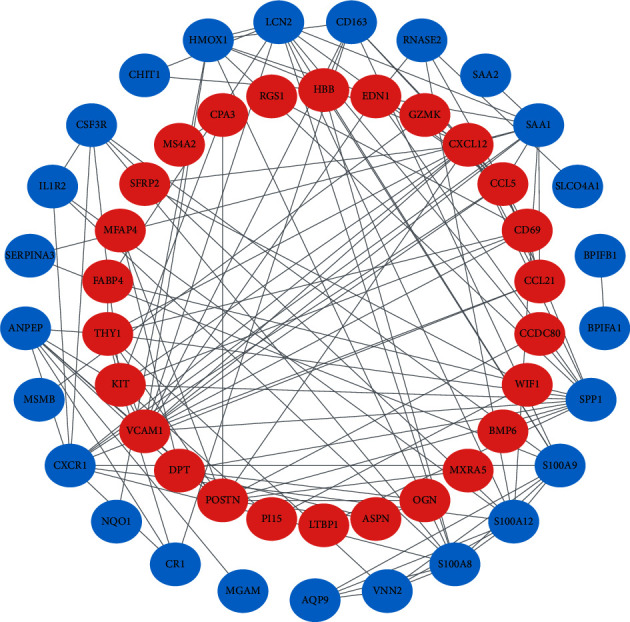
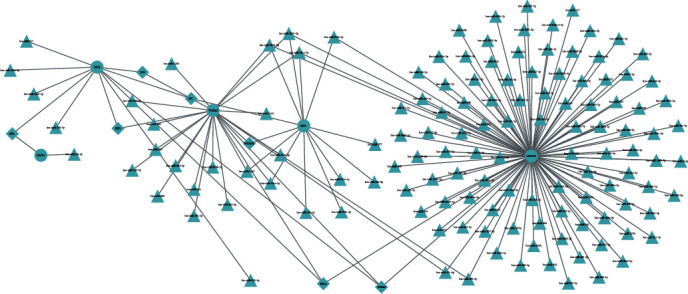
Results: 69 DEGs were identified between PAH samples and normal samples. GO and KEGG pathway analyses revealed that these DEGs were mostly enriched in the inflammatory response and cytokine-cytokine receptor interaction, respectively. The miRNA-hub genes network was conducted subsequently with 131 miRNAs, 7 TFs, and 5 hub genes (CCL5, CXCL12, VCAM1, CXCR1, and SPP1) which screened out via constructing the PPI network. 17 drugs interacted with 5 hub genes were identified.
Conclusions: Through bioinformatic analysis of microarray data sets, 5 hub genes (CCL5, CXCL12, VCAM1, CXCR1, and SPP1) were identified from DEGs between control samples and PAH samples. Studies showed that the five hub genes might play an important role in the development of PAH. These 5 hub genes might be potential biomarkers for diagnosis or targets for the treatment of PAH. In addition, our work also indicated that paying more attention on studies based on these 5 hub genes might help to understand the molecular mechanism of the development of PAH.
Copyright © 2021 Yu Zeng et al.
Conflict of interest statement
The authors have no conflicts of interest.
Figures
Similar articles
-
Screening of key biomarkers and immune infiltration in Pulmonary Arterial Hypertension via integrated bioinformatics analysis.Bioengineered. 2021 Dec;12(1):2576-2591. doi: 10.1080/21655979.2021.1936816. Bioengineered. 2021. PMID: 34233597 Free PMC article.
-
The identification and verification of hub genes associated with pulmonary arterial hypertension using weighted gene co-expression network analysis.BMC Pulm Med. 2022 Dec 13;22(1):474. doi: 10.1186/s12890-022-02275-6. BMC Pulm Med. 2022. PMID: 36514015 Free PMC article.
-
Identification of Differentially Expressed Genes Associated with Idiopathic Pulmonary Arterial Hypertension by Integrated Bioinformatics Approaches.J Comput Biol. 2021 Jan;28(1):79-88. doi: 10.1089/cmb.2019.0433. Epub 2020 Jun 3. J Comput Biol. 2021. PMID: 32493063
-
Identification of novel biomarkers involved in pulmonary arterial hypertension based on multiple-microarray analysis.Biosci Rep. 2020 Sep 30;40(9):BSR20202346. doi: 10.1042/BSR20202346. Biosci Rep. 2020. PMID: 32886110 Free PMC article.
-
Application of transcriptomics and proteomics in pulmonary arterial hypertension.Per Med. 2023 Mar;20(2):183-192. doi: 10.2217/pme-2023-0020. Epub 2023 May 17. Per Med. 2023. PMID: 37195212 Review.
Cited by
-
FAM171B as a Novel Biomarker Mediates Tissue Immune Microenvironment in Pulmonary Arterial Hypertension.Mediators Inflamm. 2022 Sep 22;2022:1878766. doi: 10.1155/2022/1878766. eCollection 2022. Mediators Inflamm. 2022. PMID: 36248192 Free PMC article.
-
In silico Methods for Identification of Potential Therapeutic Targets.Interdiscip Sci. 2022 Jun;14(2):285-310. doi: 10.1007/s12539-021-00491-y. Epub 2021 Nov 26. Interdiscip Sci. 2022. PMID: 34826045 Free PMC article. Review.
-
Decoding ceRNA regulatory network in the pulmonary artery of hypoxia-induced pulmonary hypertension (HPH) rat model.Cell Biosci. 2022 Mar 7;12(1):27. doi: 10.1186/s13578-022-00762-1. Cell Biosci. 2022. PMID: 35255963 Free PMC article.
-
Molecular Characterization and Elucidation of Pathways to Identify Novel Therapeutic Targets in Pulmonary Arterial Hypertension.Front Physiol. 2021 Jul 23;12:694702. doi: 10.3389/fphys.2021.694702. eCollection 2021. Front Physiol. 2021. PMID: 34366885 Free PMC article.
-
Role of microRNA-34b-5p in cancer and injury: how does it work?Cancer Cell Int. 2022 Dec 1;22(1):381. doi: 10.1186/s12935-022-02797-3. Cancer Cell Int. 2022. PMID: 36457043 Free PMC article. Review.
References
MeSH terms
LinkOut - more resources
Full Text Sources
Other Literature Sources
Research Materials
Miscellaneous
